 ,
,
December 31, 2021
It is no wonder that clients often ask us about Tesla stock. In recent years, Tesla has taken on an outsized presence in the public imagination, driven by an electric vehicle (EV) frenzy, the surge of ESG/impact investing, interest in renewable energy technology, high-profile CEO Elon Musk, and retail investor enthusiasm. This enthusiasm has, in turn, sent Tesla’s share price skyrocketing to absurd valuations untethered from the stock’s fundamentals.
For all the optimism about Tesla’s future earnings, even seasoned equity analysts have a hard time coming up with a consensus valuation. Opinions differ drastically, with current stock price targets by market professionals ranging from $67/share to $4,000/share.
For all the market optimism about Tesla, even seasoned equity analysts have a hard time coming up with a consensus valuation. Here are some scenarios for the electric vehicle company’s future, few of them rosy.
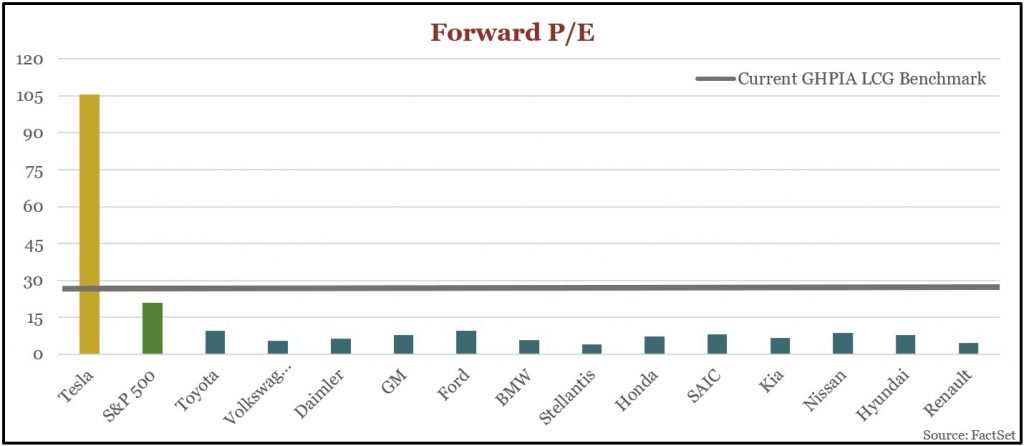
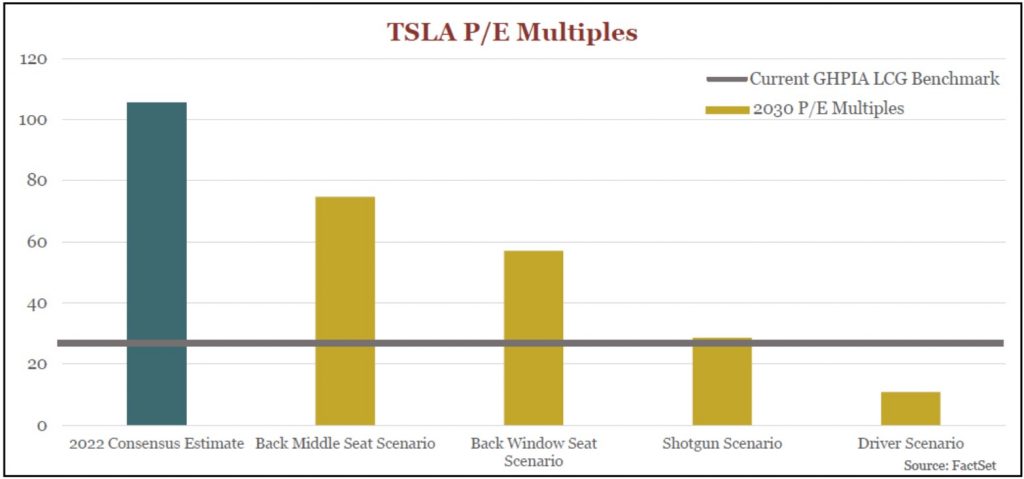
At GHPIA, we determine reasonable valuations for stocks based on several benchmarks. One of the most familiar is forward P/E, or price-to-earnings ratio, a figure that tells investors what premium they are paying for each dollar of expected earnings one year from now. For large-cap growth (LCG) stocks, including major car manufacturers, we consider companies with forward P/E ratios above 27 to be overvalued. At this writing, most car companies are trading well under our benchmark, while Tesla trades at nearly four times our benchmark. (See chart below.)
Before diving into several scenarios for how Tesla may perform over the next decade, it is worth looking back at Tesla’s history.
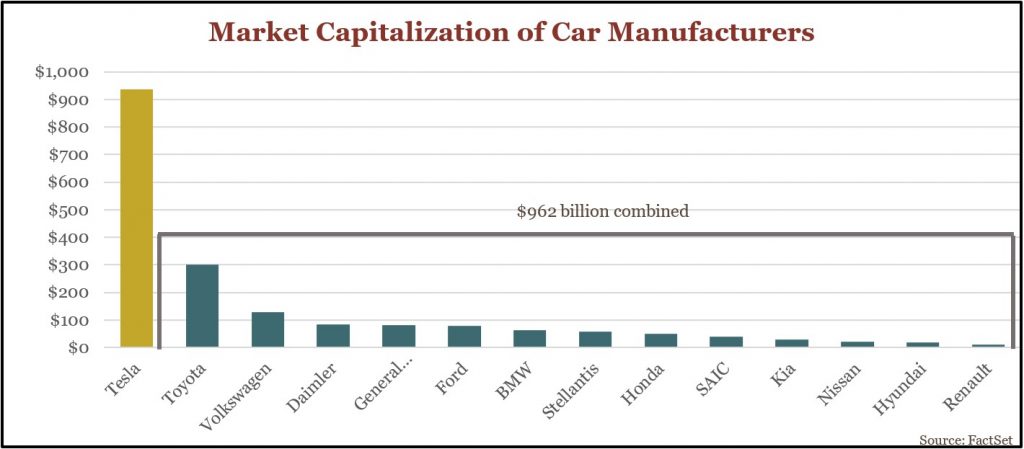
Martin Eberhard and March Tarpenning founded Tesla in 2003, with the mission to produce an entirely electric vehicle. Elon Musk joined the team in 2004, investing $30 million into the company and becoming the chairman of the board. The company’s flagship Tesla roadster prototype entered production in 2008, the same year that Musk took over as CEO. Facing many financial hardships, Tesla found some relief when it went public in 2010, raising over $226 million in the IPO. Eleven years later, Tesla leads the way in the EV market and has a market capitalization of $937 billion, which is almost more than the next 14 largest auto manufacturers combined! (See chart below.)
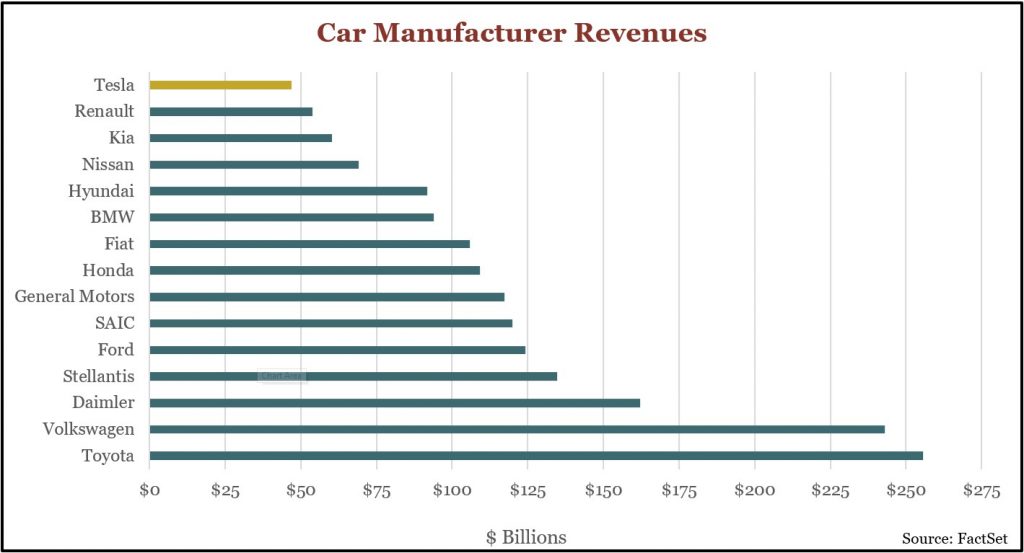
Despite this phenomenal feat, Tesla generated only $46.8 billion in revenue over the past year, behind all noteworthy competitors. (See chart below.)
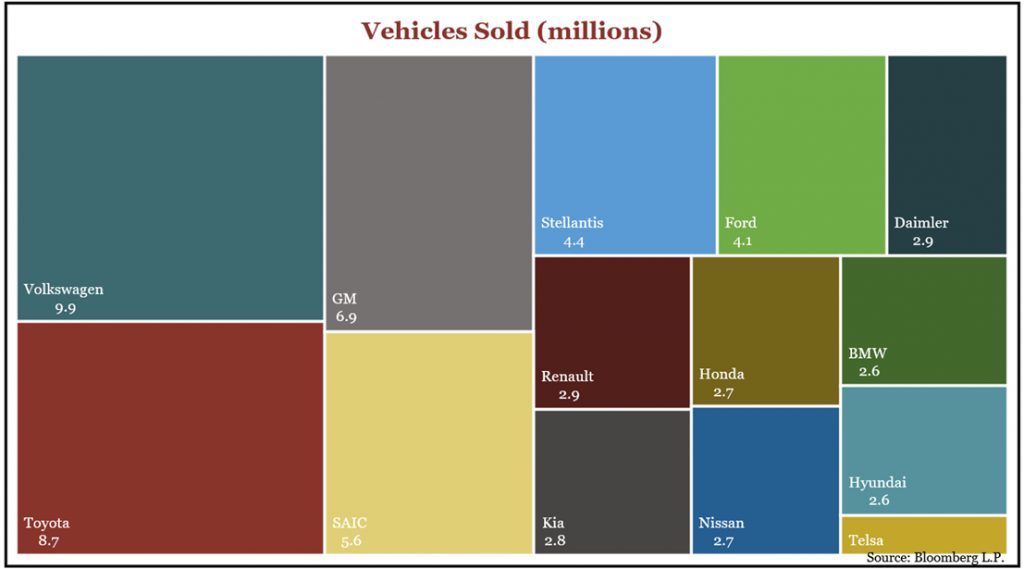
As for total vehicles sales, Tesla sold just 808,000 cars during the past four quarters, compared to a combined 58.7 million by their competitors. For Tesla, this translates into current market value of $1,159,000 per vehicle sold, compared to only $16,000 for their competitors!
The question becomes obvious: How can Tesla be worth as much as all its competitors combined, despite having such limited market share in its industry? The answer may lie in the possible scenarios we have gamed out for Tesla’s future. For these scenarios, we are using the International Energy Agency’s base case forecast, which assumes passenger EV sales will be 25.8 million in the year 2030. This forecast translates into a compounded average growth rate (CAGR) of 23% in EVs sold over the next decade.
Let us jump into a few scenarios and see which seat you are in.
Tesla delivered over 386,000 units in the 1H 2021, which equates to a market share in EVs of 14.5%. Assuming Tesla maintains that market share, by 2030 total vehicles sales would be 3.74 million units. If the average selling price (ASP) for Tesla vehicles remains at last quarter’s ASP of $48,850, this translates into revenue of ~$183 billion in 2030. Assuming profit margins remain steady at 7.4% over the next decade equates to an earnings CAGR of 8% through 2030 and Tesla trading at a whopping 75 times 2030 earnings.
For this scenario, let us assume Tesla captures more market share, but in doing so becomes less profitable. Currently, no car company has more than 14.5% of the EV market share or more than 11% of the total car market share. Still, let us suppose Tesla achieves a 25% EV market share. or 6.45 million vehicles sold. With an industry average profit margin of just over 5.5%, that translates into bottom line growth of 11% until 2030 and a current P/E multiple of 57 times 2030 earnings, which is still high relative to our benchmark.
Moving to the front passenger seat, let us assume Tesla keeps 25% market share, as above, but doubles the industry average in terms of profitability (or 11.26%) in 2030. In this scenario, Tesla will need to grow earnings at 20% per year through 2030 and currently trades at 29 times 2030 earnings.
Okay, finally to the driver seat. What if Tesla crushes all competitors and takes 100% of the market share in passenger EVs? In that case, 25.8 million vehicles sold in 2030 equates to $1.26 trillion in revenue (Note: this scenario keeps the ASP at $48,850, although it seems highly unlikely ASP can remain this high if Tesla captures the entire market). Suppose profit margins can remain intact as well, at 7.4%. The result would be earnings growth of 34% per year through 2030! (Very few companies achieve sustained earnings growth at that level.) In this scenario Tesla trades at 11 times 2030 earnings.
While the Shotgun and Driver case scenarios may look promising for Tesla, remember our benchmark indicates LCG companies should trade no higher than 27 times next year’s earnings. And these scenarios are estimating the P/E multiple on earnings nine years from now! (See chart below.)
While the scenarios above give our team insight into how the market is valuing Tesla’s business, they are merely assumptions. We do not know for certain the number of EVs that will be sold in the year 2030, nor do we know how many cars Tesla will produce and sell in subsequent years, and at what profit margins, but we can aggregate industry data to better inform our views about what the future may hold.
For instance, the most troublesome part of Tesla’s valuation may be the competitive landscape of its industry. While Tesla may have the current edge on competition in the EV space, since it is already mass producing EVs, many competitors have laid out aggressive plans to increase their exposure to the EV market. (See infographic below.)
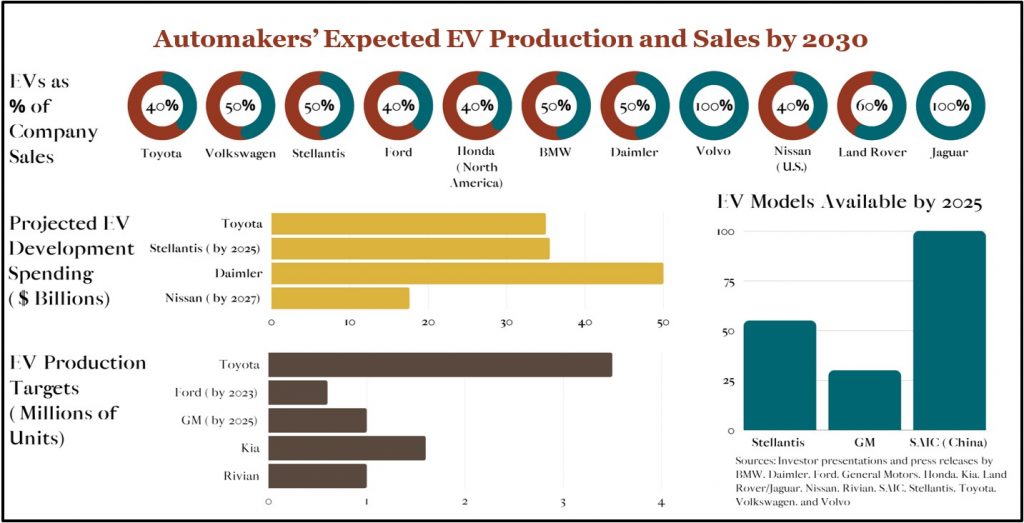
Although Tesla has transformed the automotive landscape and disrupted industry norms, it seems farfetched to believe Tesla alone will completely dominate the EV market over the next decade – as it must in order to achieve what we consider a reasonable valuation (based on its currently elevated share price).
Granted, our scenarios do not take into account the possibility that Tesla may develop different avenues for growth, such as software-as-a-service, autonomous driving, and robotaxi. Nonetheless, at its core, Tesla will likely continue to derive most of its revenue from vehicle sales (88% as of last quarter). So only in the rosiest of our scenarios does Tesla start to seem like a reasonably valued stock.
Such regard for fundamentals seems not to have diminished the market optimism surrounding Tesla, and indeed, some market-timing Tesla investors may be lucky enough to enjoy short-term gains. Our long-term investment philosophy, along with Tesla’s imbalanced and unstable risk/reward profile, has us riding in the back seat for now.
For more on how investors should think about renewable energy and the technologies behind it, please read our recent Global Markets newsletters on the lithium extraction industry and the carbon trading market.
Investment Insight is published as a service to our clients and other interested parties. This material is not intended to be relied
upon as a forecast, research, investment, accounting, legal or tax advice, and is not a recommendation, offer or solicitation to buy or sell any securities or to adopt any investment strategy. The views and strategies described may not be suitable for all investors. References to specific securities, asset classes and financial markets are for illustrative purposes only. Past performance is no guarantee of future results.