 ,
,
March 31, 2021

In this age of free stock trades and online research tools, some wealth management firms are downplaying investment selection while emphasizing the other services they provide. At GHPIA, however, we believe our investment selection process provides unique and essential value to clients. To help us create customized portfolios for every client, we have developed a proprietary, consistent, and sustainable framework for identifying quality stocks.
To stay disciplined and realistic when evaluating companies, we rely on our Investment Risk Scorecard. This approach helps our team quantify the exposure of companies and industries to factors such as market risk, economic risk, financial risk, operating risk, and obsolescence risk. Key metrics used to identify these risks include: Valuations, Growth, Profit Stability, Leverage, and Quality of Earnings. Our team assigns companies a numerical score for each of these attributes in order to determine a holistic aggregate score. To better explain our process, let us take a deeper dive into these five fundamentals that help steer our team toward favorable investment opportunities.
No doubt you have read, in financial reports and in GHPIA’s newsletters, the phrase, “Past performance is no guarantee of future results.” While that caveat is true when it comes to predicting the performance of investments, careful study of the past does allow us to make educated guesses about what to expect. After all, market valuations are expressions of investors’ best guesses about the future values of stocks and funds.
Our investment selection process offers a proprietary, consistent, and sustainable framework for identifying quality stocks.
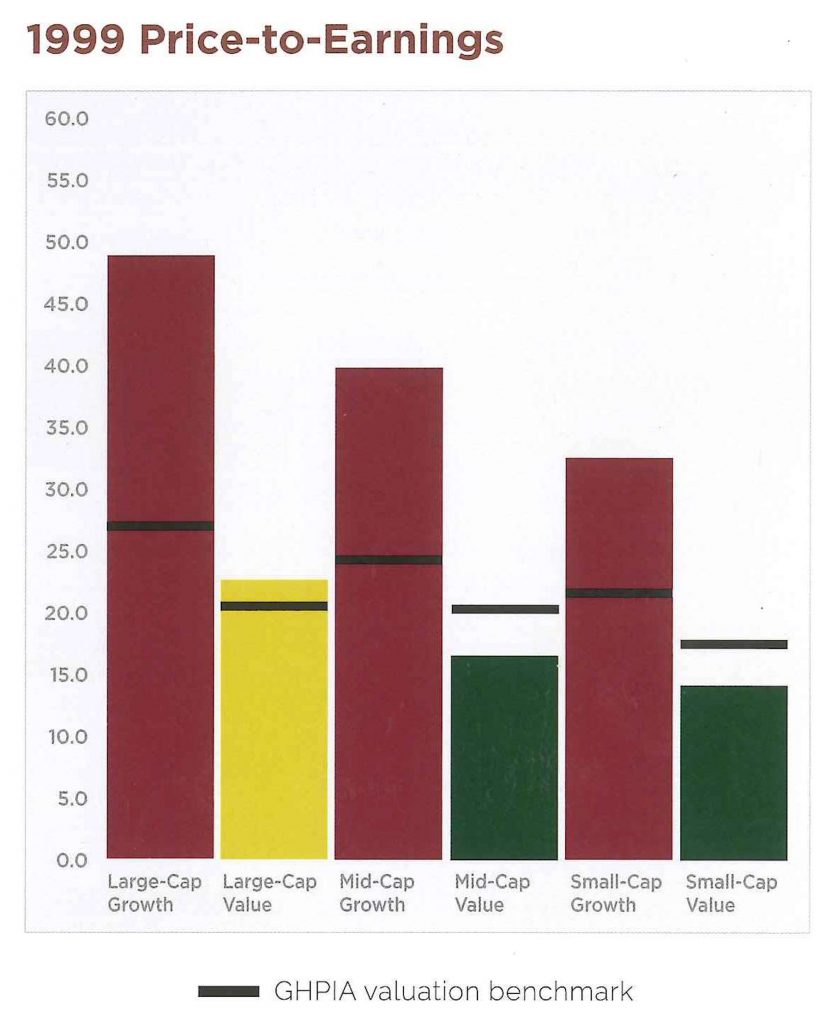
To determine whether those valuations are reasonable, GHPIA has developed several valuation benchmarks. GHPIA scores companies based on such ratios as Price to Earnings (P/E), Price to Cash Flow (P/CF), and Price to Book (P/B), giving the highest score to companies that we believe are in a “valuation sweet spot.” When companies and asset classes exceed our benchmarks, that is an indication that those stocks may be overvalued, while valuations drastically lower than our benchmarks may indicate financial distress.
As we noted in our recent videos explaining our valuation benchmarks, examples of how this methodology detects excessive risk are the 1999 dot-com bubble and the 2008 real estate bubble. Before the bubble burst in 1999, Large Cap Growth (LCG) stocks, including many tech stocks, had been trading at 50 times earnings, nearly double our P/E benchmark for that asset class. This phenomenon drastically lowered our valuation scores for LCG stocks and encouraged us instead to invest in asset classes that were more in line with our benchmarks. Similarly, real estate investment trusts had been violating our P/E benchmark for years before the 2008 crash, offering a warning bell that real estate was overvalued.
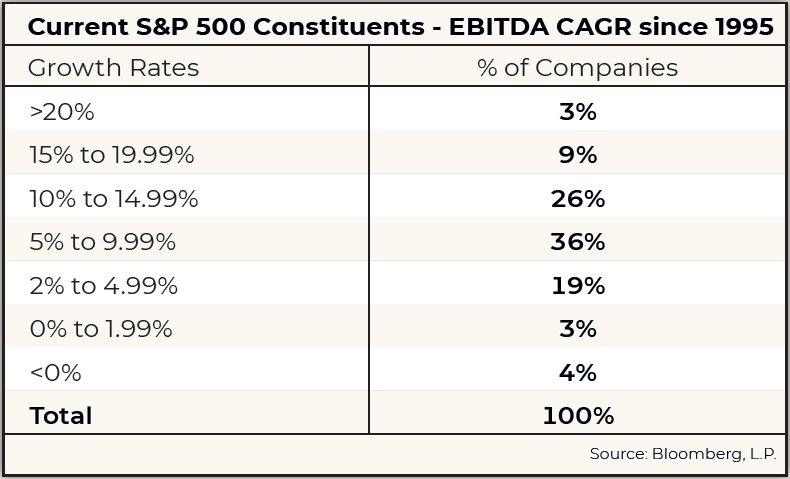
As with valuation, we can apply historical data in order to project realistic expectations of a company’s future earnings growth. These data help us narrow down the list of companies for which we expect strong and steady growth. For example, the table at right contains current S&P 500 constituents that have been in business since 1995. Only 3% of these companies have seen growth in EBITDA (earnings before interest, taxes, depreciation, and amortization) of 20% or more per year. This framework gives us a sensible way to score past and projected growth of companies and industries. We can then base our numerical growth score on short- and long-term growth of earnings, as well as cash flow.
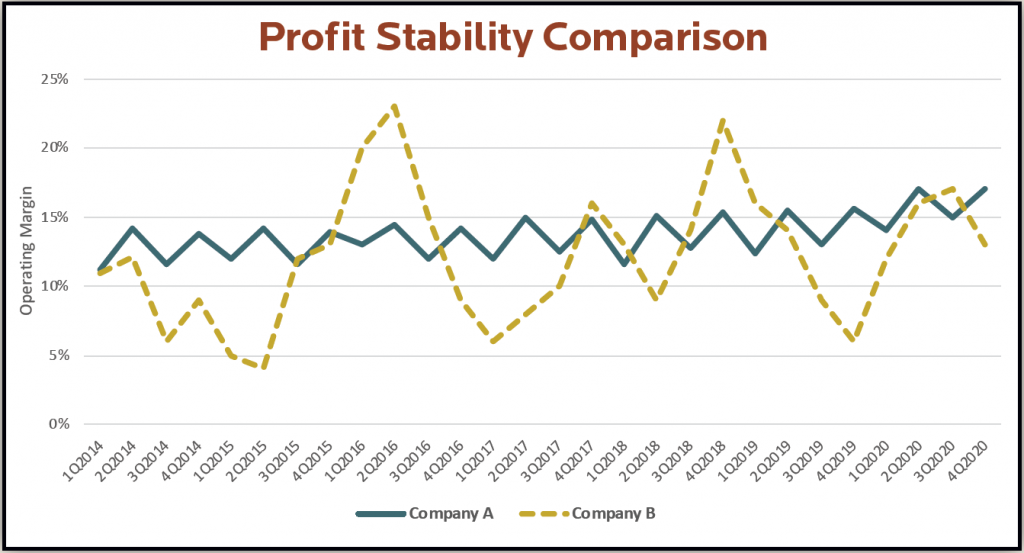
Our proprietary Profit Stability Score (PSS), which we explain in depth in our newest video, gives analysts insight into a company’s operating performance throughout business cycles. We calculate this ratio by dividing the company’s average quarterly profit margin by the standard deviation of that profit over a given period. The lower the deviation, the lower the volatility, and the higher the score. A high PSS generally indicates lower exposure to such operating risks as high fixed costs, poor management decisions, an overly competitive marketplace for the company’s products and services, and product failure or obsolescence.
To better explain PSS, let us look at the example on the following chart. Company A has withstood the ups and downs of business cycles, as denoted by the flattish blue line, while company B has seen sporadic profits over the last 12 years. Both companies may have similar average profit margins, but the standard deviation from that average will be much higher for company B, reducing its Profit Stability Score. Company A, on the other hand, delivers consistent operating profits and will have a much higher PSS.
For an in-depth look at our proprietary Profit Stability Score, watch our latest video.
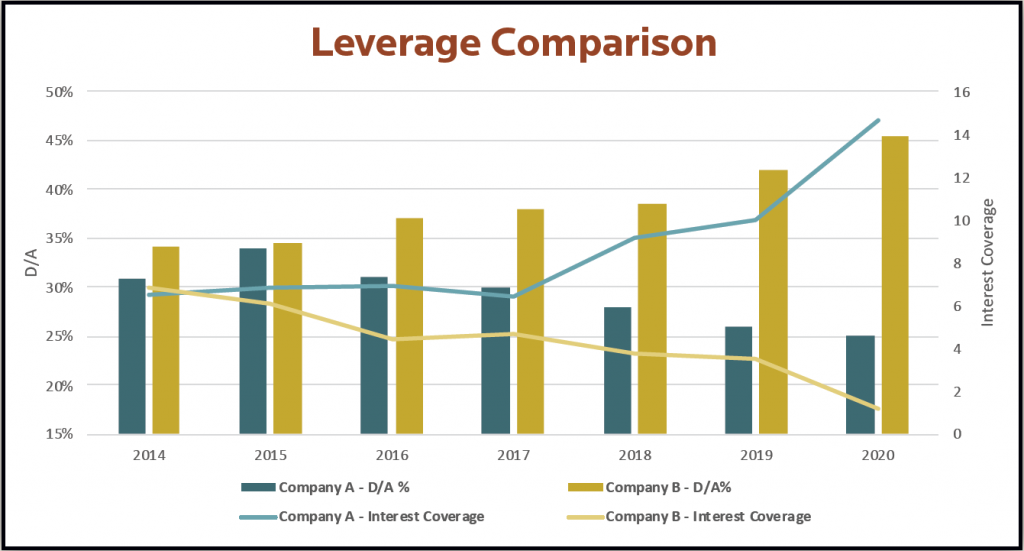
Among the ratios that help us measure a company’s leverage, we focus on total debt as a percentage of total assets (D/A) and interest coverage. The D/A ratio shows the degree to which a company has used debt to finance its asset base. For example, if a company has a D/A ratio of 30%, creditors finance 30% of its assets, while the company’s owners finance the other 70%. A lower percentage suggests a greater degree of financial flexibility.
The interest coverage ratio measures how comfortably a company can pay interest on its outstanding debt, so the higher the ratio the better. An example is below: Only Company A displays improving financial flexibility. Company B, however, shows a deteriorating financial profile and could be at risk of default if interest rates rise. Applying a numerical score to these metrics helps our team understand how the company has grown and acquired its assets and whether the company’s leverage risk profile is improving or deteriorating.
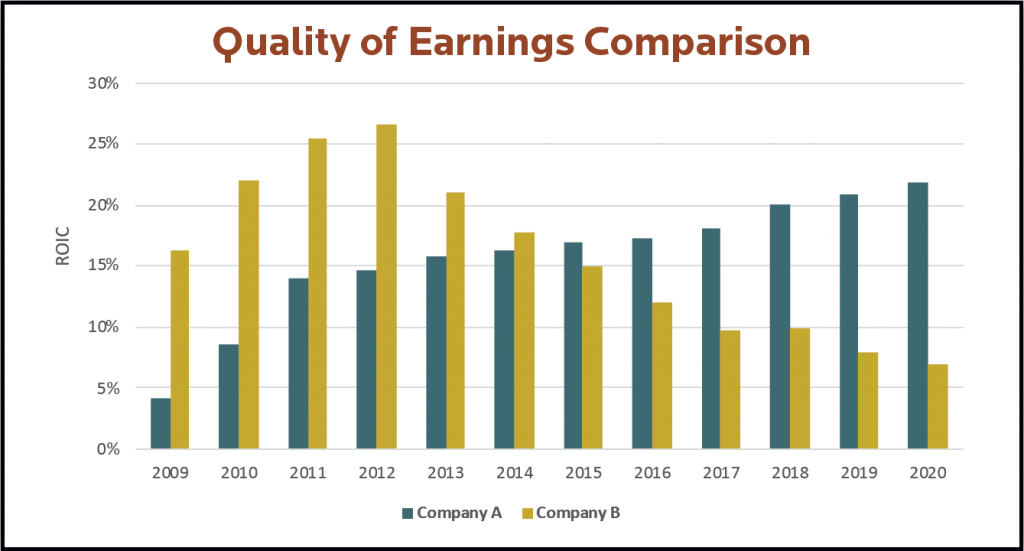
While valuations and historical growth rates give us clues to the market’s estimate of the company’s value, ratios like Return on Invested Capital (ROIC) allow our team to understand the quality of the underlying business. ROIC shows how much profit the company earns for each dollar it invests in its business, or how much value is the company creating. This score helps us understand whether companies are generating surplus value for shareholders or potentially destroying value.
To better explain, in the chart below, Company A has seen improving ROIC over last decade while Company B has seen deteriorating ROIC. Judging by this ratio, it appears that Company A has been able to turn its top line revenue into additional profits and may be gaining a competitive advantage against peers, while company B may be better off allocating capital elsewhere.
We combine all five of these scores together to help our team zero in on the highest quality companies that may be undervalued by the market. Stocks that score at the top of our list then undergo an in-depth and rigorous analysis by our Investment Committee. This analysis includes reviewing annual and quarterly company reports, analyzing company financials, evaluating competitive advantages, reviewing news items or presentations related to the company, building financial models to understand the company’s profitability and growth potential, and interviewing company investor relations representatives.
Our analysts then prepare and present internal research reports to the Investment Committee. Only if the stock has the unanimous support of the committee does it join GHPIA’s buy list. Even then, the process continues, as the committee routinely evaluates each stock in GHPIA client portfolios to make sure it still adheres to our benchmarks.
By the time a stock makes it into your portfolio, you can be certain it has been through multiple stages of analysis. You can also be certain we will continue to monitor it, ensuring our long-term outlook for the company is still favorable and the stock remains an appropriate selection for your investment strategy.
Investment Insight is published as a service to our clients and other interested parties. This material is not intended to be relied upon as a forecast, research, investment, accounting, legal or tax advice, and is not a recommendation, offer or solicitation to buy or sell any securities or to adopt any investment strategy. The views and strategies described may not be suitable for all investors. References to specific securities, asset classes and financial markets are for illustrative purposes only. Past performance is no guarantee of future results.