 ,
,
October 13, 2022
Asset bubbles are not a new phenomenon. The first recorded asset bubble, known as Tulip Mania, occurred in the mid-17th century. In the 1630s, tulips represented a new luxury product in the Netherlands, which had expanding trade networks and increased wealth among its people. Prices of tulips rose because they were hard to cultivate, and supply could not keep up with demand. Trade of tulips, particularly those with a rare coloration, elevated the prices rapidly, which in turn created more demand and further increased prices. In February of 1637 the price of tulips dropped unexpectedly, and the first asset bubble popped.
Examples of more familiar and recent bubbles include the dot-com crash in 2000 and the subprime mortgage crisis in 2008. So, what exactly is a bubble? It is a market cycle with rapid escalation of a particular asset, or in other words, a period when asset prices dramatically deviate from intrinsic values. For example, during the dot-com bubble investors got very excited about the use and adoption of the internet and piled money into unprofitable startup internet companies.
From October of 1998 to March of 2000 the Nasdaq index grew by 260% only to come tumbling back down 78% by October 2002. During this historic period, companies and investors lived by the mentality of growth over profits. Fast forward 20 years and we witnessed history repeat itself once again, albeit not all speculative excesses are created equal.
When bubbles burst, speculation tends to disappear, and rational thinking typically takes over with much greater emphasis on company profitability among other fundamentals.
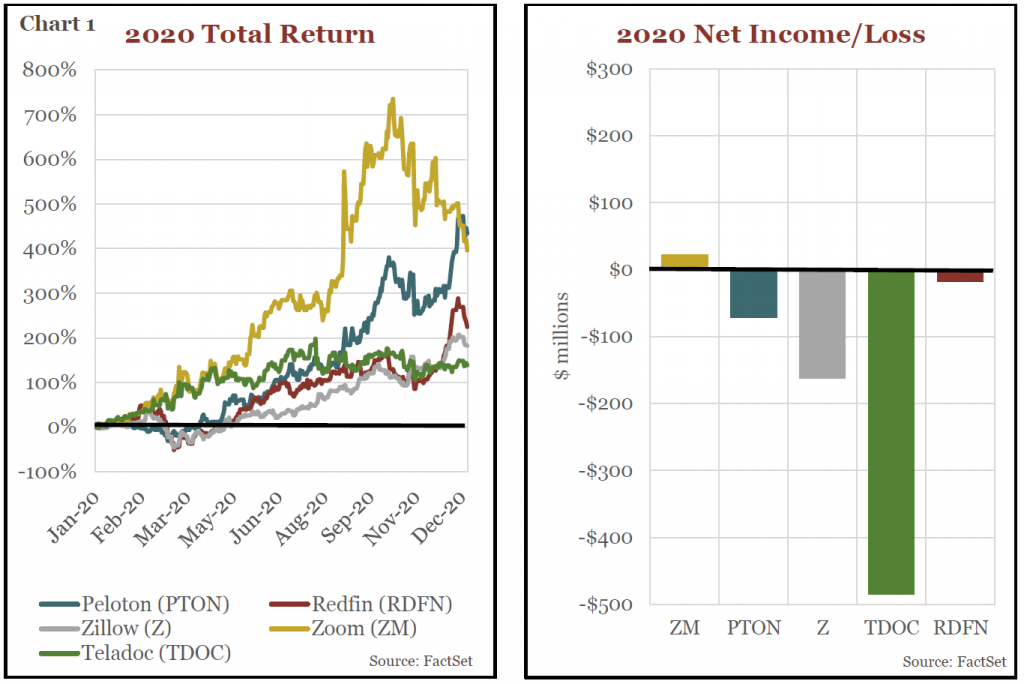
During the COVID-19 pandemic, many people found themselves stuck at home with little to do and turned to the stock market for entertainment. While some people likely felt the need to replace lost income or had extra cash from the U.S. government, these conditions created one of the largest booms in retail trading history. Envestnet Yodlee, a software and data aggregations company, reported that in 2020, Americans earning annual salaries between $35,000 and $75,000 increased their stock trading by 90% after receiving stimulus payments. Investors piled into stay-at-home winners with little regard for company fundamentals, profits, or valuation. During 2020 alone, COVID darlings like Zoom Video (ZM) and Peloton (PTON) saw their share prices increase nearly 400%, with other companies like Teladoc (TDOC), Zillow (Z) and Redfin (RDFN) up over 140%. While one may argue some price gains were justified given increased consumer demand, the problem was many of these companies were struggling to earn a profit (see Chart 1 below).
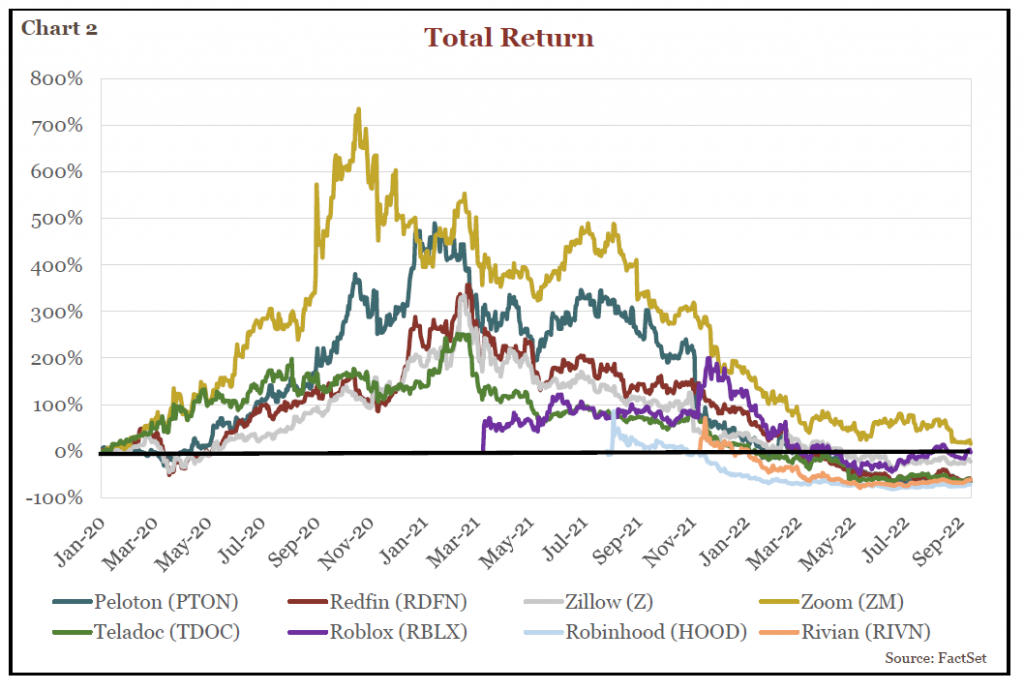
The frenzy did not stop in 2020. January 2021 saw the “meme” stock craze and debacle with video game reseller GameStop’s (GME) stock price up over 1,000% in just over one month. Care to guess their net income in 2020? If you answered losses of $215 million, you are correct. The hysteria continued into the spring and summer with the most initial public offerings (IPOs) ever recorded in a single year. Over 1,000 new companies hit the public markets in 2021 with the majority coming to market via the Special Purpose Acquisition Companies (SPAC) route (a SPAC is a “blank check company” with the purpose of merging with a private company, thereby making it public without going through the traditional initial public offering process). Some of the hottest IPOs in 2021 included Roblox (RBLX), Robinhood (HOOD), and Rivian (RIVN). Within just days of their respective IPOs, all three stocks were up over 70% from their IPO prices. Their combined net income in 2021? A shocking $8.65 billion in losses.
The euphoria diminished in the fall of 2021 when the U.S. inflation reading climbed to 9.1%, its highest level in 40 years. The Federal Reserve signaled to market participants they were preparing for the sharpest monetary policy tightening in decades in an attempt to bring down prices and tamp down market excess. The end of cheap money was here and so ended another bubble era with the irrational growth over profit mentality. At peak, market capitalizations of all the companies mentioned above were worth a combined $552 billion. As of September 15, 2022 their combined market capitalizations were $115 billion, a staggering 80% loss or $437 billion dollars from the highs (see Chart 2 below).
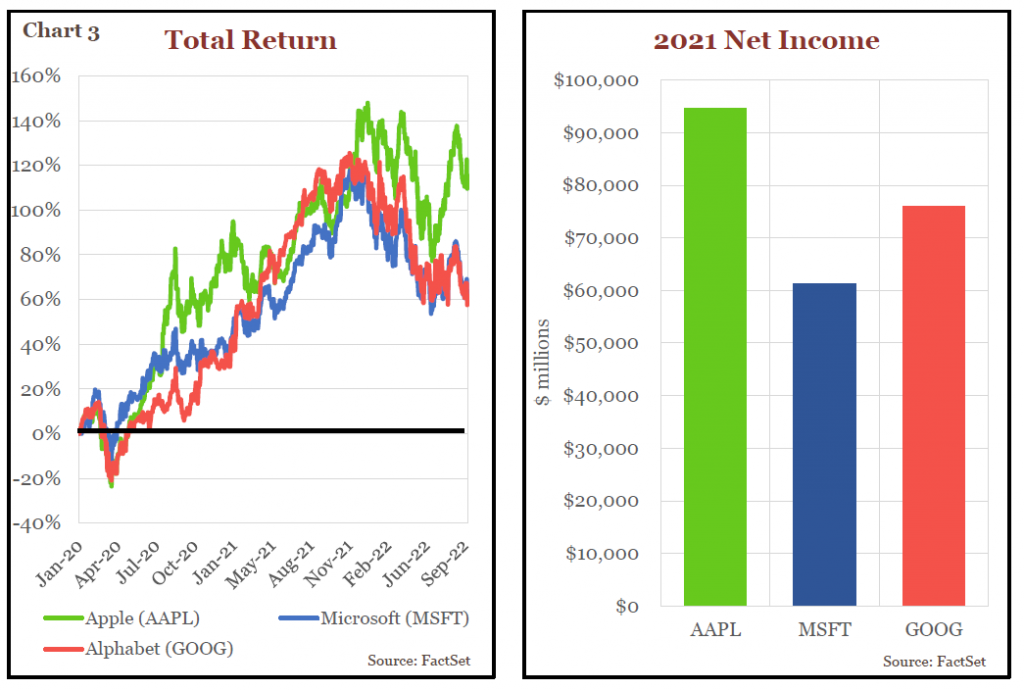
The market run up and sell off did not only impact these unprofitable companies. Even profitable growth stocks like Apple (AAPL), Microsoft (MSFT), and Alphabet (GOOG), who were once up over 120% since the start of the pandemic, saw their share prices fall as higher interest rates triggered a rotation out of even blue-chip companies. However, while the unprofitable companies lost 80% or more of their value from their peak, and nearly all have negative returns since the start of 2020, these more stable tech behemoths have held up much better. Why? These three companies reported combined net income of $232 billion in 2021 (see Chart 3 below).
While the COVID bubble may sound and feel similar to the dot-com collapse, the scale and duration are the differentiators. For example, at the peak of the dot-com bubble the Wilshire 5000 Total Market Index (which includes all traded equity securities in the U.S.) reached $14.8 trillion only to fall to $7.3 trillion after the dust settled (~49% loss). In comparison, during the pandemic the Wilshire 5000 peaked at $49 trillion and has since pulled back to $39 trillion (as of 9/15/2022), only a 20% decrease. As for duration, the recent bubble lasted for 18 months compared to nearly 60 months during the dot-com era.
When bubbles burst, speculation tends to disappear, and rational thinking typically takes over with much greater emphasis on company profitability among other fundamentals. While we do see headwinds for the market in the coming months, primarily inflation related, our concerns have stayed subdued. Corporate and household balance sheets remain strong, the job market remains healthy, and supply chain bottlenecks continue to ease. For investors like us, we feel lower asset prices present a refreshing opportunity to buy profitable companies that may have looked overvalued in the past.
Investment Insight is published as a service to our clients and other interested parties. This material is not intended to be relied upon as a forecast, research, investment, accounting, legal or tax advice, and is not a recommendation, offer or solicitation to buy or sell any securities or to adopt any investment strategy. The views and strategies described may not be suitable for all investors. References to specific securities, asset classes and financial markets are for illustrative purposes only. Past performance is no guarantee of future results.