 ,
,
April 11, 2024
Consumer spending is the backbone of the U.S. economy, representing 70% of the gross domestic product (GDP). In the current economic context, spending patterns are somewhat mixed. While factors like lingering inflation, dwindling savings and interest rates put pressure on household budgets, a strong dollar and labor market provides some stability for spending.
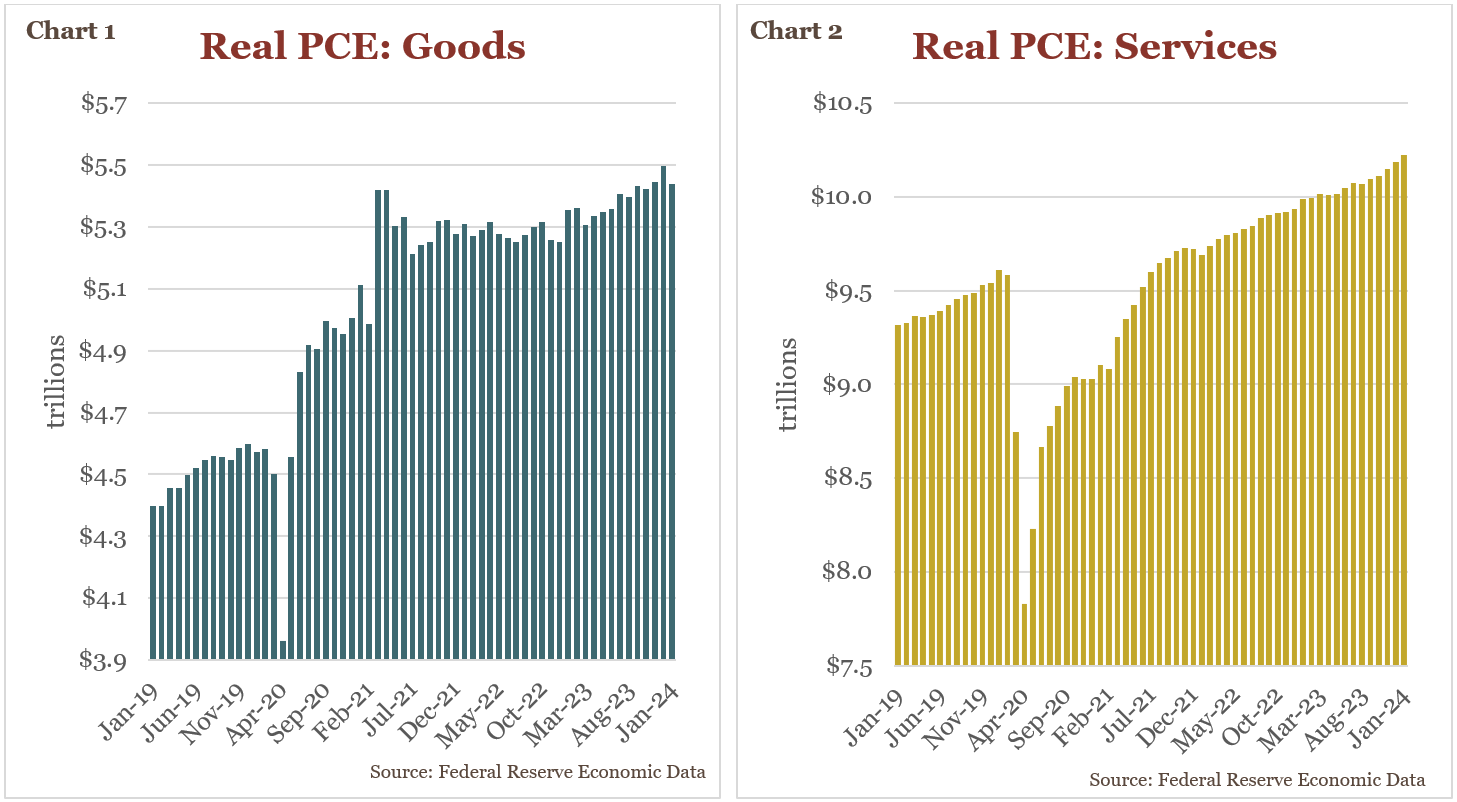
Consumer spending in the United States has undergone significant shifts in recent years. After a period of pandemic related restrictions and excess savings fueled a surge in online and goods-based spending, 2023 saw a normalization with spending redirected towards services.
Overall, household spending remains healthy but is slowing. Real personal consumption expenditures (PCE) rose 2.2% year over year in 2023, down from the 2.5% increase in 2022 and an 8.4% increase in 2021. Looking at early 2024 data shows that real PCE fell 0.1% from December levels, led by weakness in goods spending (see Chart 1) even as services spending rose (see Chart 2).
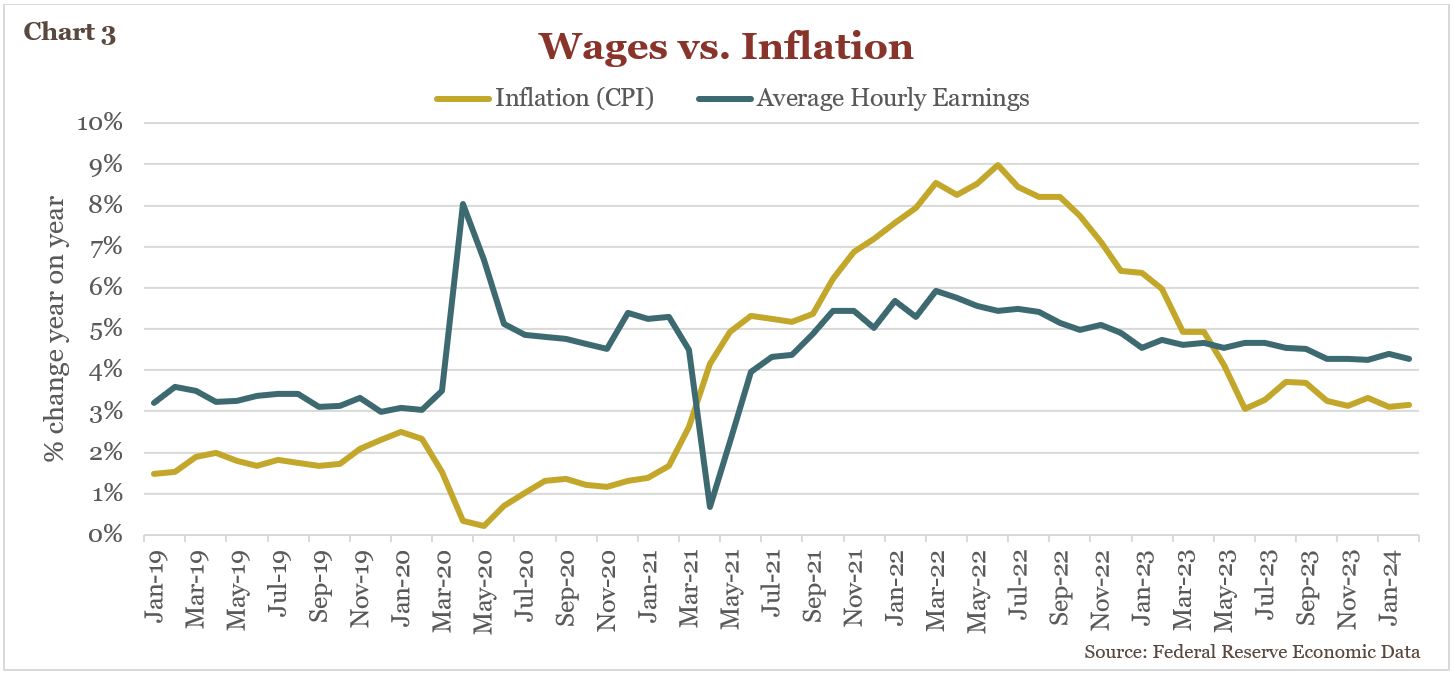
Despite recent signs of a spending slowdown, the labor market remains resilient with unemployment under 4% and wage growth, while continuing to moderate, now back above inflation levels (see Chart 3). Combined with some improvement in consumer sentiment, these dynamics could represent a potential counterbalance and suggest that the slowdown in consumer spending may be tempered.
Reliance on credit card debt remains a good indicator of consumer spending patterns. Recent figures show average credit card balances rising, however delinquencies and real, or inflation adjusted, credit balances are only slightly elevated to pre-pandemic levels.
The mortgage market has been marked by recent volatility. Home buyers have responded to higher mortgage rates as rational economic actors by remaining on the sidelines as they wait for more favorable conditions. Existing home sales dropped throughout 2023 and have begun to tick back up in the first few months of 2024 in anticipation of further reductions to interest rates–a possible sign that demand is pent up and ready to be unleashed if mortgage rates continue to become more attractive.
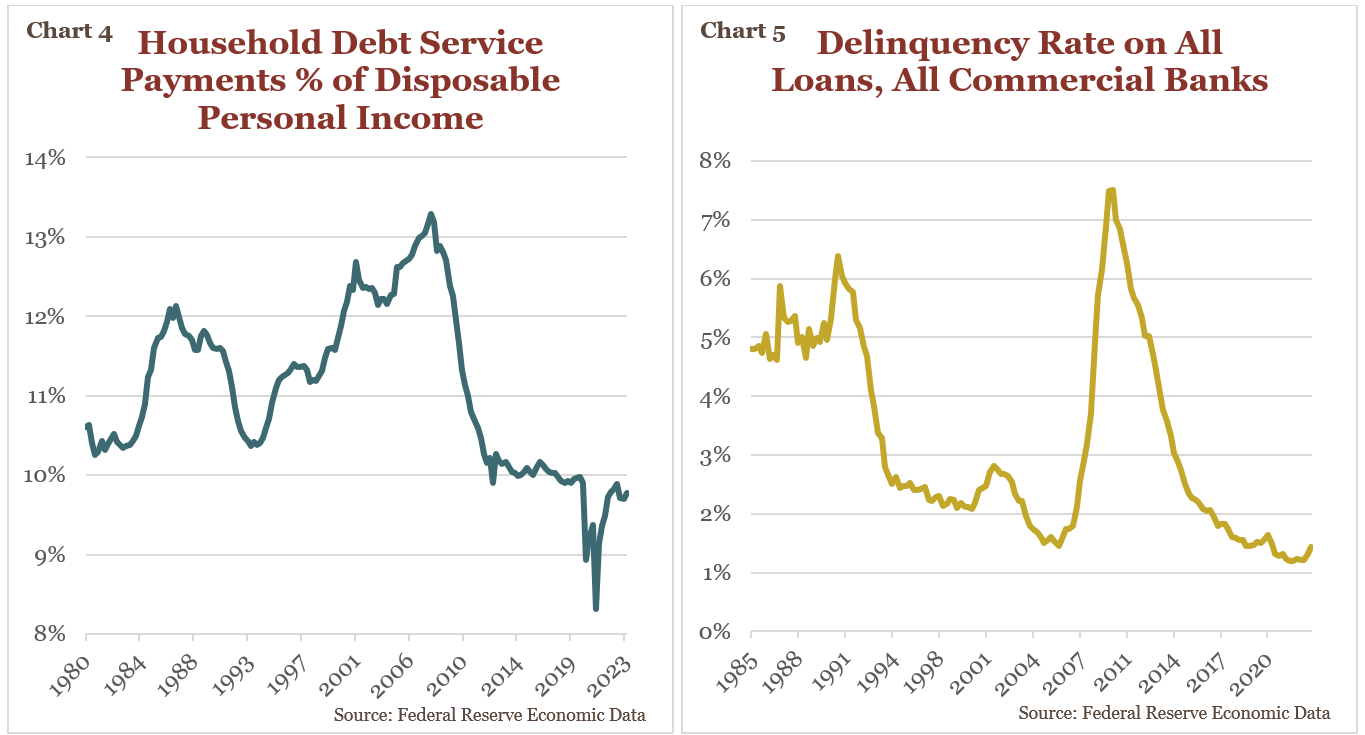
Despite the rising value of household debt in absolute terms, debt service as a percentage of disposable income has barely ticked up, remains below pre-pandemic levels and well below averages in the decades prior to the Financial Crisis (see Chart 4). Likewise, while loan delinquencies have started ticking up, they are still below pre pandemic levels and are not currently raising any alarms (see Chart 5).
Consumer confidence surveys are painting a nuanced picture of the American economic landscape. While some surveys, like the Conference Board’s Consumer Confidence Index, have shown recent improvements, others, like the University of Michigan’s Index of Consumer Sentiment, present a more cautious outlook. This divergence points to a mix of optimism and pessimism among consumers. Some may be buoyed by a strong labor market and signs of easing inflation in certain sectors. However, stubbornly high inflation in areas like groceries, dining out, vehicles, housing, and leisure travel may have a disproportionate impact on overall economic outlook as the way consumers feel about inflation is heavily influenced by recent experiences, a phenomenon known as recency bias. Decelerating price growth doesn’t provide the warm fuzzy feeling that one might get if automobile, food, and flight prices fell back to 2020 levels.
While the post-pandemic spending surge may have come to an end, the resilient labor market and healthy household balance sheets suggest consumers retain considerable purchasing power. Job security and wage growth will be key indicators over the coming months, as a recession is unlikely if unemployment remains low and wage growth continues to outpace inflation (refer back to Chart 3). Decelerating inflation will also play a role as any cut to interest rates should help boost consumer confidence, corporate profits, and spending. Though undesirable for consumers, it would be tolerable to see inflation persist slightly above target and interest rates to remain “higher for longer”. After all, the current status quo would be welcomed by a consumer of many decades’ past. Optimism is best served with a side of caution, but betting that a deep recession is nigh would be to bet against the American consumer—a stance not proven wise by historic precedent–especially as long as the “cracks” are superficial, and foundation remains intact.
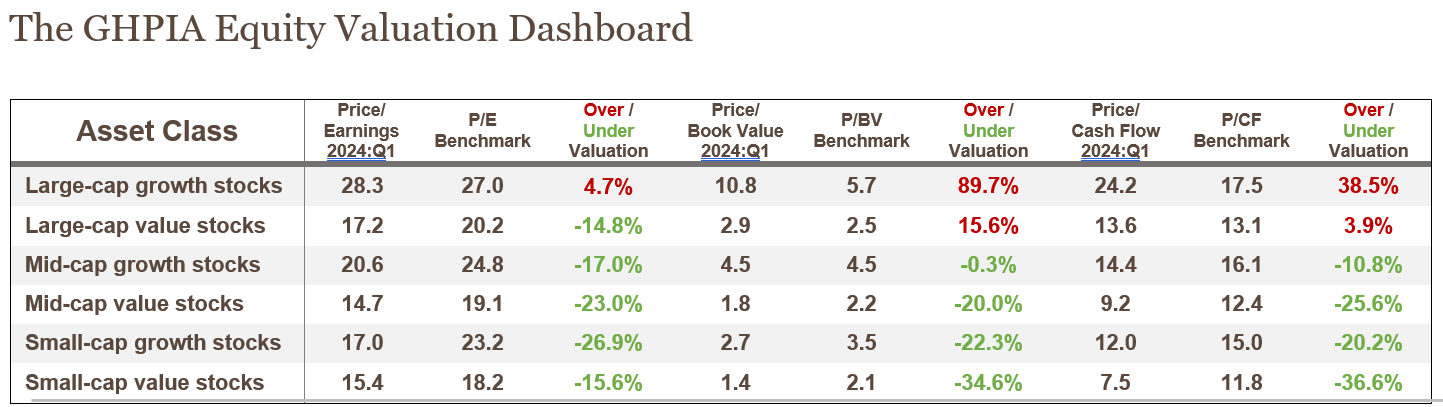
GHP Investment Advisors, Inc. Benchmarks are determined using any combination of valuation approaches deemed relevant by GHPIA, including Price to Earnings (P/E), Price to Cash Flow (P/CF), and Price to Book (P/B), and other relevant analyses. Consideration is given to such factors as historical and projected financial growth for the company, profit stability, leverage, the quality of earnings, valuations of comparable companies, the size and scope of the company’s operations, the strengths and weaknesses of the company industry information and assumptions, general economic and market conditions, and other factors deemed relevant. While Benchmarks are based on valuations and assumptions that GHPIA believes are reasonable under the circumstances, actual realized returns on such investments may differ materially and do not take into account any fees or expenses that may be associated with investing in those assets. There is no assurance that the investment objectives and strategies described herein will be achieved or successful. P/E, P/BV, and P/CF data are provided by FactSet.
Investment Insight is published as a service to our clients and other interested parties. This material is not intended to be relied upon as a forecast, research, investment, accounting, legal, or tax advice, and is not a recommendation, offer or solicitation to buy or sell any securities or to adopt any investment strategy. The views and strategies described may not be suitable for all investors. Individuals should seek advice from their own legal, tax, or investment counsel; the merits and suitability of any investment should be made by the investing individual. References to specific securities, asset classes, and financial markets are for illustrative purposes only. Actual holdings will vary for each client, and there is no guarantee that a particular account or portfolio will hold any or all of the securities listed. Past performance is no guarantee of future results. Investments carry risk and investors should be prepared to lose all or substantially all of their investment.