 ,
,
January 10, 2024
Earlier this quarter, 30-year mortgage rates briefly surpassed 8%, challenging home borrowers with the highest rates since the 1980’s. Although mortgage rates fell back slightly below 7% as 2023 draws to a close, the dynamics of the mortgage bond markets will continue to act as a headwind for borrowers for years to come. Further, home buyers are stymied by a historically thin supply of homes for sale, as home-building remains well short of demand, and as homeowners cling tightly to their existing homes and lower mortgage rates, reluctant to sell and venture back into such a difficult market. However, the good news is tight monetary policy set by the Fed has successfully taken the air out of the short-lived post-Covid housing bubble this year, as new home prices have fallen, and existing home prices have stabilized. For investors, intriguing opportunities are emerging as mortgage bond rates climb. For prospective homebuyers and sellers, high mortgage rates and tight supply should not be deemed a dealbreaker, but these factors add to the necessity to prudently develop financial plans in advance of these big transactions.
Within these newsletters, we have often used the analogy that the U.S. 10-year Treasury bond is like the sun, with all other interest rates like the planets orbiting around the 10-year at varying distances. As for the 30-year fixed mortgage rate, its location in the solar system has generally been spaced about 1.8% higher than the 10-year Treasury bond rate over the last several decades, with the exceptions of the early 1980s and the more recent momentary bond market panics during the Financial Crisis and Covid’s onset. In financial vernacular, we call this 1.8% the “spread to Treasuries”. Recently, however, the 30-year mortgage rate spread climbed to 3% (see Chart 1), roughly doubling since the ultra-low rate Covid housing boom in 2021. In other words, when considering the last 20+ years, other than episodes of extreme market panic, this is the only time mortgage rates have been this unmoored from Treasury bond rates.
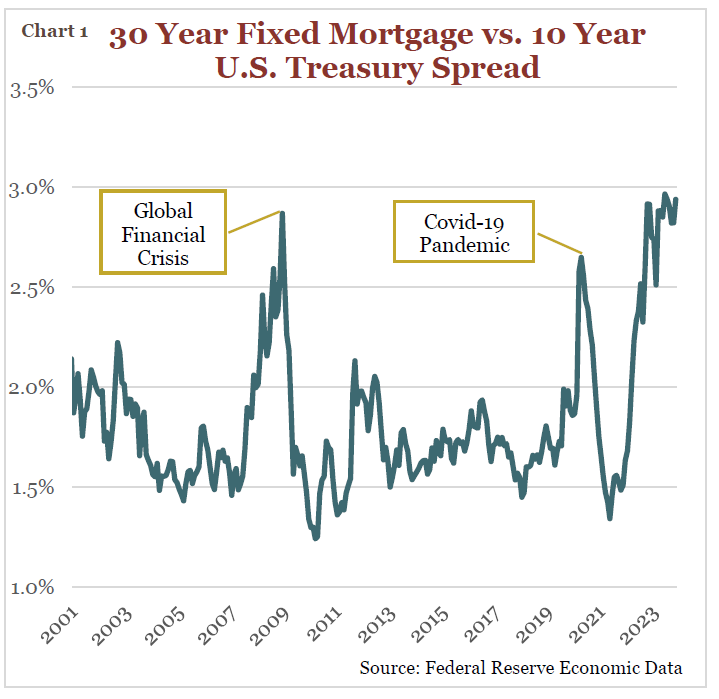
Though this extra spread may sound trivial, it actually translates to thousands of dollars shaved off the list price to sell a home as buyers rein in their offers to offset prohibitively higher interest expenses. For example, as mortgage rates have climbed over the past 18 months, the median sale price of newly built homes in the U.S. fell by over $60,000 or 12.5% – a relative drop in prices only exceeded once in the last 50 years, in the aftermath of the 2008 housing bubble. Meanwhile, existing home prices held up better this year when compared to falling new home prices, but higher rates have effectively slowed or, depending on location, reversed the price appreciation on existing home sales experienced in 2021-2022.
Ultimately the primary force behind this dislocation of mortgage rates appears to be lackluster demand from investors for mortgage bonds. Demand for mortgage bonds drives bond prices higher and rates lower. The two biggest buyers that have recently stepped away are the Fed and U.S. banks. One of our strongest attributes in the U.S. is our robust bond and credit markets, which feed into our vibrant residential home market. Our residential mortgage bond market is approximately $10 trillion, of which banks and the Fed hold roughly $5 trillion (or 50%) of these assets. However, Fed and bank demand for mortgage bonds has been waning with the Fed committed to slowly reducing the size of its balance sheet (having ballooned from $4 trillion to over $8 trillion during the pandemic), and as banks shore up their balance sheets in response to the bank crisis this spring.
Unlike the highly distressed eras of 2008 and 2020, the Fed will not be running to the rescue of borrowers and accommodating them with quantitative stimulus to bring mortgage rates down. Similarly, it may be some time before banks, still fearful of a run on deposits, ante back up as aggregate buyers of mortgage bonds. As these big buyers leave the room, this is when we plan to enter, but as always, slowly and cautiously for only a small portion of our clients’ bond portfolios. On the other hand, unfortunately for mortgage borrowers, when over 50% of demand for mortgage bonds has evaporated, it is unlikely prevailing spread to Treasuries will be narrowing in the short-term. In other words, even if interest rates are cut in 2024, mortgage rates will remain at elevated spreads to Treasury bond rates, adding extra pressure on borrowers.
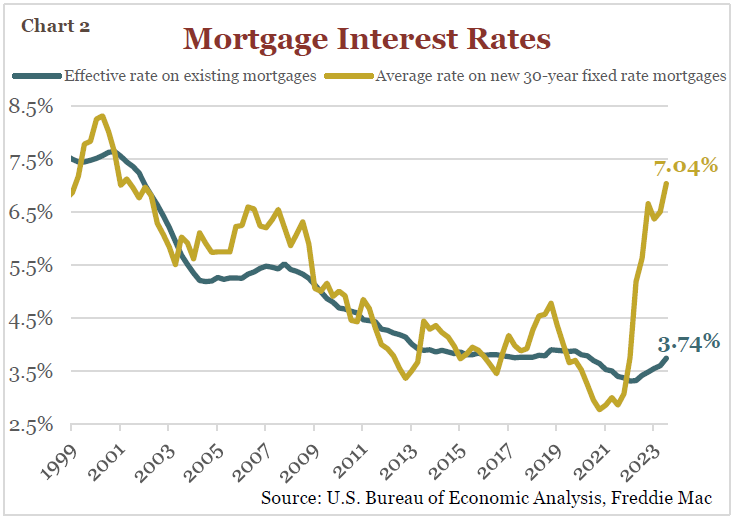
Ever since the disastrous housing bubble burst in 2008, household formation (think new families and more demand) in the U.S. has outpaced the construction of new homes (supply). So often the case after a major crisis, the pendulum swings too far the other way. For more than a decade now banks have been tight fisted (and tightly regulated) with residential construction loans, tapering down lending from roughly $200 billion annually pre-2008, to only $100 billion last year. Likewise, since the Financial Crisis, home builders have proven risk averse and there are fewer home building companies overall. As for the supply of existing homes, the ultra-low mortgage rate era of the past 15 years has allowed borrowers ample opportunity to secure rates much lower than prevailing mortgage rates today, creating a disincentive for those willing to sell their homes and step into a new mortgage rate, nearly doubling their existing rate (see Chart 2). Ultimately, these dynamics have led to a recent scarcity of inventory of homes for sale, supplies which are running at roughly half of their 40-year averages.
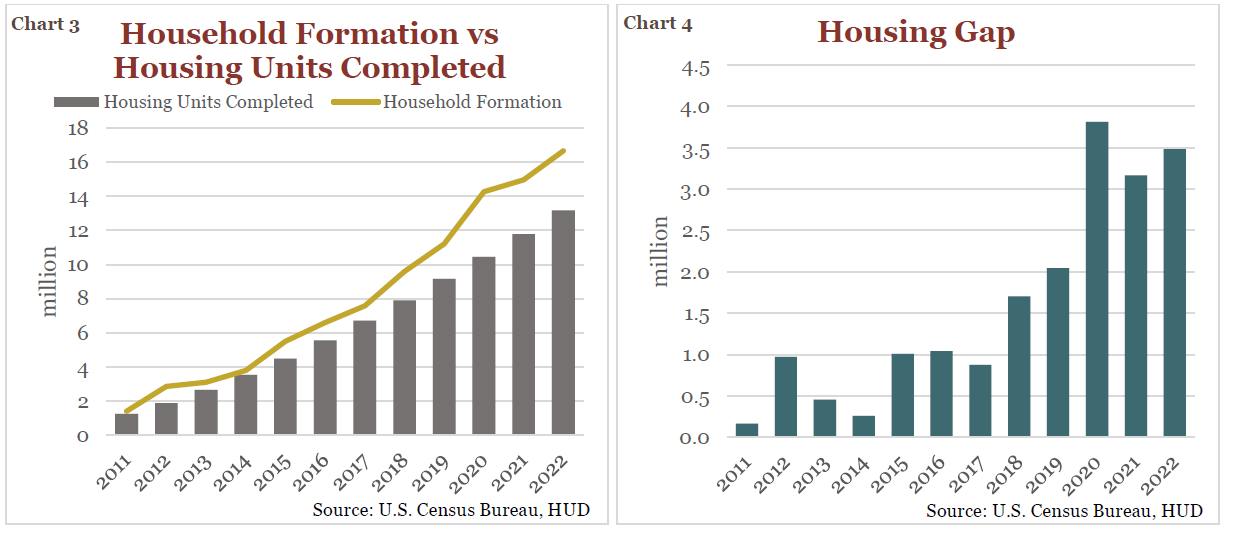
Meanwhile, as our population grows, the Millennial cohort embarks on home ownership, and as pandemic trends place a greater emphasis on the value of standalone personal space, the demand for homes now exceeds supply by an estimated 3.5 million units (see Charts 3 & 4). As the housing supply and demand imbalance grows, this issue becomes more structural than cyclical, which suggests short-term solutions are unachievable. Moreover, as demand far outstrips housing supply, it appears unlikely home prices will fall precipitously in the coming years, even as high mortgage rates have arrested pandemic era price appreciation.
“This old house, she’s quite the keeper, quite the keeper of you” – Gregory Isakov
After 18 good years, my family and I decided to sell our City Park Denver home recently and move to the suburbs of Littleton. In 2005, we purchased our old home, built in 1910 (just after Teddy Roosevelt’s presidency), for $282,000. As our family grew, we did everything to max out the space with two major remodels and an extension project, adding roughly $350,000 to our cost basis. Upon selling the home this fall, and after considering realtor fees, seller concessions (the pandemic frenzied days of selling a home “as is” are over), and final repairs (pesky old clay sewer line), we netted $952,000. Thus, after 18 years our internal rate of return (IRR) was 2.3%. Inflation during this same period averaged 2.5%. We will miss our old home, she was quite the keeper, so too the community of neighbors we adored for nearly two decades. However, it was not an investment, as the IRR was soundly beaten by a diversified stock portfolio over the same 18-year stretch. Moreover, the cost basis for this analysis does not include all the years of home maintenance expenses, which would further dampen our net IRR.
When advising clients and creating financial planning models, we have always erred on the side of caution by using conservative annual IRR assumptions of 2% for residential real estate and 6.5% for investments. Our advice, especially with younger clients, is to ensure they can save and invest far beyond their mortgage and home maintenance expenses. In other words, the adage that, when buying a home, your reach should exceed your grasp, comes with a heavy dose of financial prudence.
Also, just as we avoid market timing strategies when investing in stocks, we follow the same discipline when advising clients that inquire when to time the purchase or sale of their residence. Financial planning and long-term analysis concerning affordability and unique personal circumstances will always supersede attempts to perfectly time the housing market.
The last quarter of this year was a wild one for interest rates. The 10-year Treasury bond (the sun) briefly crested 5% in October, then dropped below 4% to finish the year. This is good news for borrowers, as mortgage rates have likewise pulled back from multi-decade highs, but spreads to Treasuries will remain elevated. Adding to this pressure is the chasm between demand for homes and the supply of homes for sale. However, if mortgage rates continue to fall, the supply of existing homes for sale may be boosted as sellers warm to more acceptable rates to swap up to when moving. Such a development has the potential to rein in higher home prices, but overall market forces will continue challenging post-pandemic home affordability levels. Dorothy was right, “there’s no place like home”, which is why deep bargains for buyers will be scant in the years ahead.
Investment Insight is published as a service to our clients and other interested parties. This material is not intended to be relied upon as a forecast, research, investment, accounting, legal, or tax advice, and is not a recommendation, offer or solicitation to buy or sell any securities or to adopt any investment strategy. The views and strategies described may not be suitable for all investors. Individuals should seek advice from their own legal, tax, or investment counsel; the merits and suitability of any investment should be made by the investing individual. References to specific securities, asset classes, and financial markets are for illustrative purposes only. Actual holdings will vary for each client, and there is no guarantee that a particular account or portfolio will hold any or all of the securities listed. Past performance is no guarantee of future results. Investments carry risk and investors should be prepared to lose all or substantially all of their investment.