 ,
,
June 30, 2022
How nervous should investors be these days? After all, the war between Russia and Ukraine continues, inflation in the United States is approaching 40-year highs, supply chain bottlenecks persist, and the S&P 500 has spent much of this quarter in bear market territory. This doom and gloom can prompt questionable financial decisions and may tempt some investors to act rashly.
Investing is not a game, and selecting stocks should be done rationally in order to avoid costly emotional mistakes in both up and down markets. GHP Investment Advisors (GHPIA) uses a quantitative, time-tested process to measure risk versus potential return. We developed and use a proprietary, consistent, and sustainable framework to determine whether individual stocks are reasonably valued. We invest in companies based on their long-term potential. We look for undervalued stocks that demonstrate strong fundamentals, such as healthy and steady profits, solid balance sheets with reasonable debt levels, and durable business models. With market multiples down nearly 25% year-to-date, we think the price is right.
Investing is not a game, and selecting stocks should be done rationally in order to avoid costly emotional mistakes in both up and down markets. We believe objective thinking and sifting through the noise are key to wealth management.
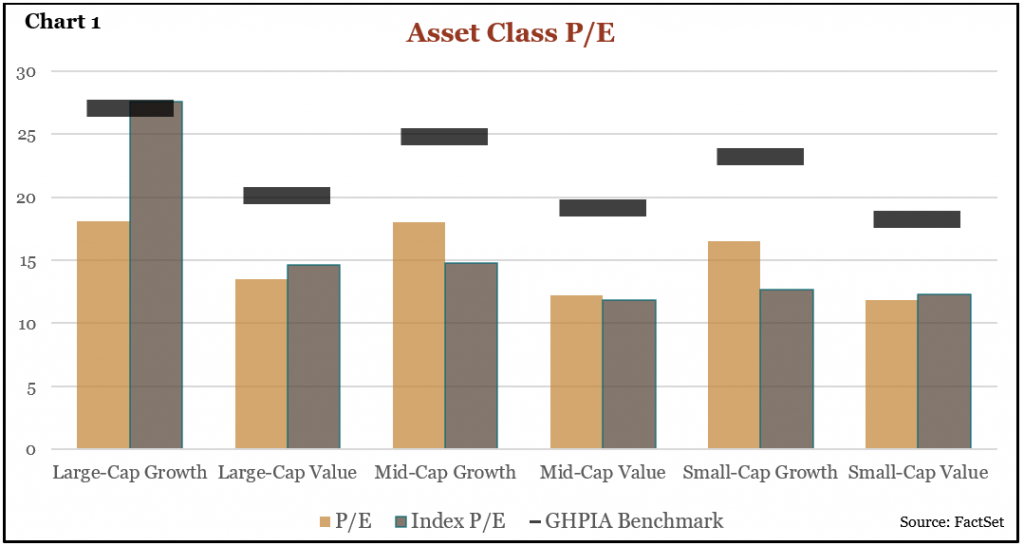
To determine whether valuations are reasonable, GHPIA scores companies on ratios such as Price to Earnings (P/E), Price to Cash Flow (P/CF), and Price to Book Value (P/B) – the benchmarks you see updated quarterly on the last page of this newsletter – giving the highest score to companies in what we consider our valuation sweet spot. When companies and asset classes exceed our benchmarks, it may be an indication those stocks are overvalued. If a stock is drastically lower than the benchmark, the company may be on a path toward financial distress.
The arithmetic of the P/E ratio is simple. If we expect a company to earn $1 per year for its shareholders, and we pay $20/share for that stock, our return should be no less than 5% (1÷20 =.05 = 5%). If, however, the company continues to grow earnings, we will also be compensated as an investor. Long-term earnings growth should allow such stocks to earn returns above 5%.
When determining benchmarks, we divide stocks by company size (large, mid, small) and company sector (growth versus value). Growth companies reinvest their earnings to grow faster over time, while value companies tend to be slower growing and typically pay higher dividends to shareholders. Therefore, we are willing to pay more for a growth company than a value company. We are also willing to pay more for large companies than small companies, since large ones tend to be well-established in the marketplace and less likely to fail. Apple is a good example of a company that was very risky in 1980 when it went public as a small company with a market capitalization of $1.8 billion but is now a large company with a market cap of $2.7 trillion (yes, trillion) and is less likely to fail given market dominance and brand loyalty.
Chart 1 shows the P/E ratios of companies purchased by GHPIA versus the average P/E ratios of stocks in the same asset classes. Prices of the companies GHPIA owns are well below our proprietary benchmark (the black solid line), indicating we are not in an overvalued market. That said, there are stocks we are currently avoiding, such as large companies in the technology sector, due to their high valuations relative to our benchmark, suggesting they are more likely to fall in value and not recover.
The GHPIA valuation benchmarks help us to avoid costly mistakes, especially in times of volatility. Zoom, a recent COVID darling, and tech veteran Cisco are two similar companies highlighting why reasonable valuations matter. In March 2020, instead of in-person meetings, professional subscriptions to Zoom became a necessity. By June 2020, as Zoom’s P/E ratio peaked, investors believed this technology was so essential that they paid over 400 times future earnings, far exceeding the GHPIA benchmark (Chart 2).
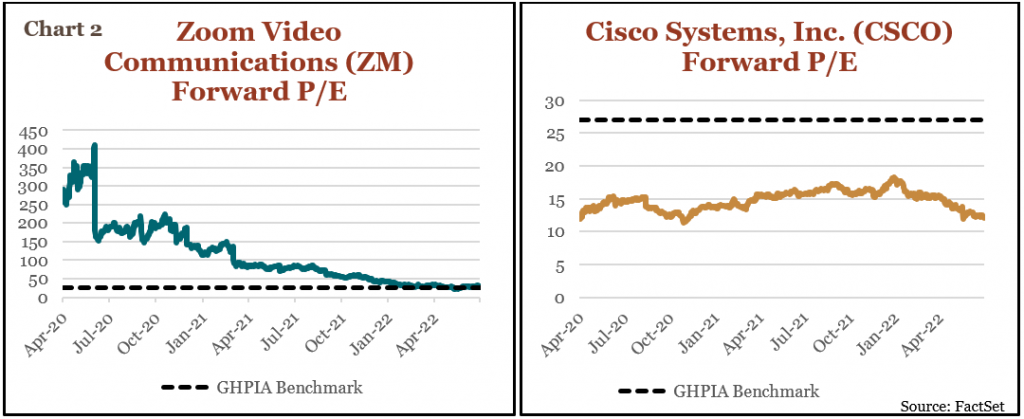
Cisco, best known for its computer networking products, owns WebEx, a competitor to Zoom. While Zoom was selling for high valuations, Cisco sold and continues to sell below our benchmark. At Zoom’s price peak in October 2020, its market capitalization reached $160 billion and surpassed the market cap of Cisco, a difference in valuations not justified by the companies’ respective fundamentals. As shown by the performance of Cisco versus Zoom in Chart 3, the market recognized Zoom was overvalued, and the stock value collapsed.
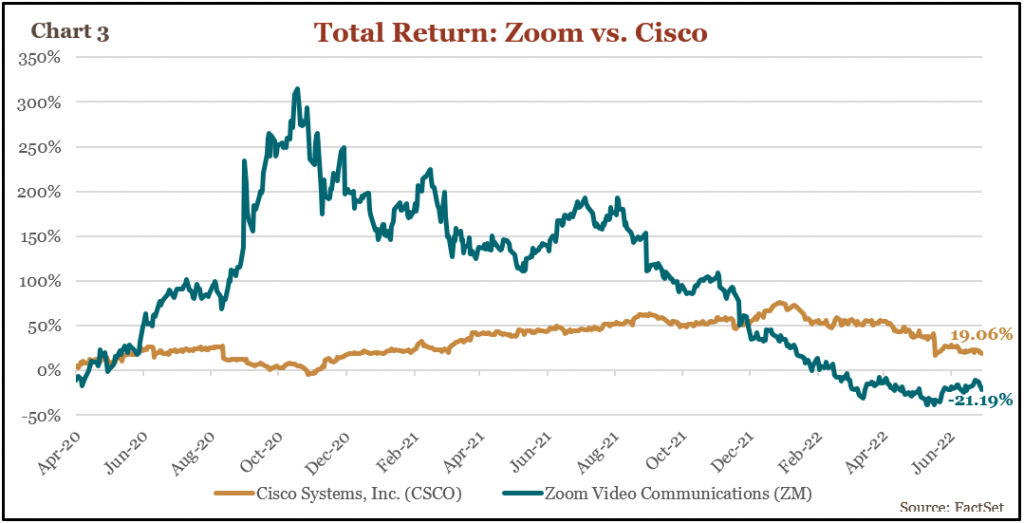
If you had invested $100,000 in Zoom on October 19, 2020, the day it peaked, your stock would have a current value of $19,000 (that is, a loss of $81,000). If instead you had purchased Cisco on that date, you would have $113,000, or a gain of $13,000. Which company would you rather own?
While debt securities are historically not as volatile as equities, they are nevertheless subject to interest-rate and inflation risk. With the 10-year Treasury yielding only 3% and the U.S. Federal Reserve targeting inflation at 2.5%, the 10-year Treasury will probably lose buying power over the next decade. Given the inverse relationship between interest rates and bond prices, if interest rates rise, bond prices will decline, causing losses in the bond market. Therefore, when we seek fixed income to avoid volatility for future portfolio withdrawals, we are currently buying bonds, Treasury bills, and CDs that will mature in less than two years, with the expectation of holding these bonds until maturity.
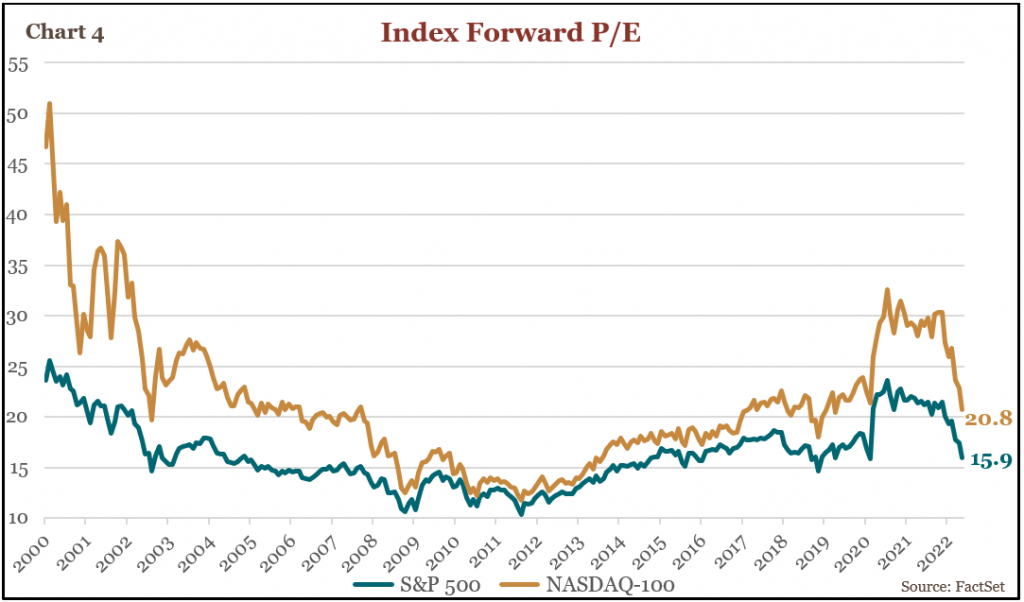
Due to this low real yield environment, we are currently allocating a higher percentage of our portfolios to equities instead of cash and fixed income in order to outpace inflation. This was not our allocation in the early 2000s when, as you can see from Chart 4, valuations were high (at the peak, large cap growth companies were selling for more than 50 times forward earnings), and 10-year Treasuries were yielding over 6%. Now, large cap growth companies are selling for less than 25 times earnings on average and the 10-year Treasury is yielding about 3%, at a time when inflation is above 8%.
Every investor’s needs, goals, and risk tolerance are different, which is why we personalize portfolio allocation strategies for each client. Nonetheless, we believe every client benefits from a long-term, holistic perspective on market events that is not overly swayed by the sentiments of the moment. We believe objective thinking, removing emotions, and sifting through the noise are key components to wealth management. Using our quantitative investment approach, we try to avoid bubbles and permanently lost value, but our portfolios are still subject to temporary, recoverable dips. “Temporary” may mean days, weeks, months, or even years, or merely several quarters.
The frequency of bear markets necessitates prudent portfolio allocation strategies that preserve and grow wealth through the ups and downs of stock prices over time. When stock prices rise, the risk of overpaying for a future dollar in earnings can lead to significant losses. Conversely, when prices drop, we recognize the risk of missed opportunity in not buying stocks with strong fundamentals and discounted valuations especially when bond yields are low. The good news for investors is the Price of Stocks is Right!
Investment Insight is published as a service to our clients and other interested parties. This material is not intended to be relied upon as a forecast, research, investment, accounting, legal or tax advice, and is not a recommendation, offer or solicitation to buy or sell any securities or to adopt any investment strategy. The views and strategies described may not be suitable for all investors. References to specific securities, asset classes and financial markets are for illustrative purposes only. Past performance is no guarantee of future results.