 ,
,
December 31, 2019

According to the conventional wisdom, the first two decades of the 21st century saw an undertone of anxiety replacing the euphoric optimism of the late 20th century. In the 1990s, the Cold War ended, democracy spread around the world, and the Internet kindled hopes of an information age utopia. Over the past 20 years, however, euphoria faded when the technology bubble collapsed, the September 11, 2001 terrorist attacks ushered in 18 years of American military conflict in the Middle East, the Global Financial Crisis wreaked economic havoc, and the Internet seemed to enable disinformation, narcissism, and political tribalism more than tolerance and understanding.
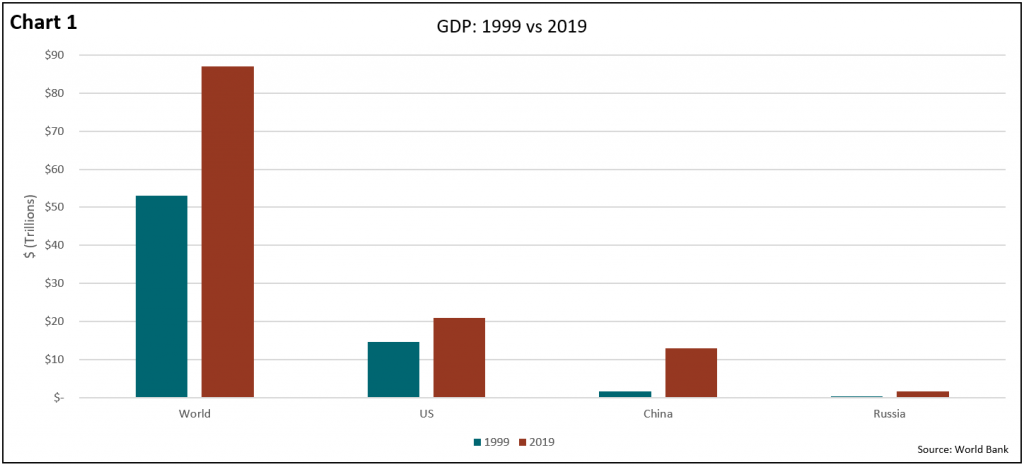
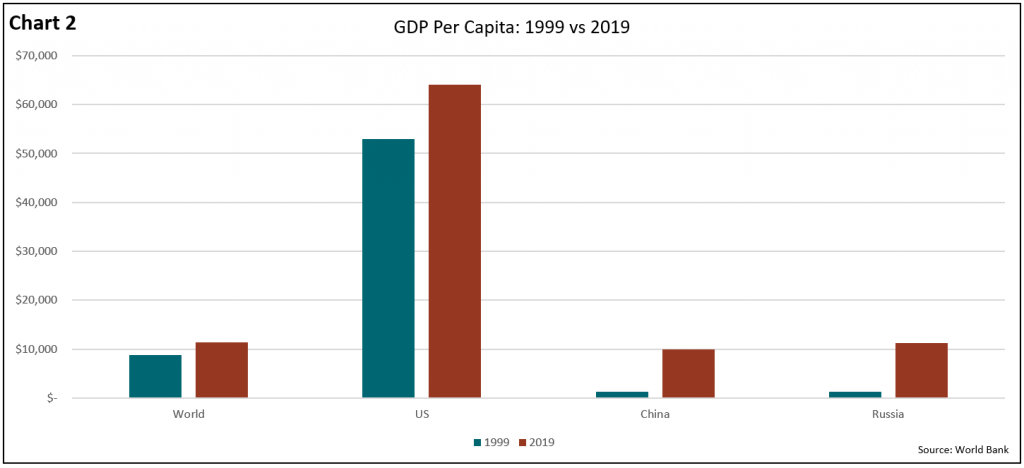
Despite the volatility and chaos of last 20 years, many people will be surprised to learn that our planet and our country are wealthier and more peaceful than at almost any point during the 20th century. This year, our world population of 7.6 billion is on track to generate $87 trillion in gross domestic product (GDP). Twenty years ago, a population of 6 billion produced $53 trillion (in 2019 dollars, with inflation adjusted by US consumer price index; see Charts 1 and 2). Even as population grew, so did income per person. Global GDP per capita increased from $8,833 in 1999 to an estimated $11,447 this year. In 1999, U.S. GDP was $14.7 trillion (in 2019 dollars) for 279 million people, or almost $53,000 per person. Today, we are a country of 329 million people producing $21 trillion, or almost $64,000 per capita.
In fact, world GDP grew faster between 1999 and 2019 (2.6% per year) than in the prior 20-year period from 1979 to 1999 (2.0% per year). Almost unnoticed by Americans, many of the civil wars and insurgencies that wracked Latin America and Africa ended. Between 1979 and 1999, Latin American economies only grew by 1.9% per year and African economies shrank a cumulative 22%. Over the past two decades, however, GDP in Sub-Saharan Africa and Latin America grew by 6% and 3.3% per year, respectively.
Not all our anxieties are unfounded. Although economic growth accelerated outside the United States, the chaos of the technology bubble implosion in 2000, the September 11, 2001 terrorist attacks, the Enron/Worldcom accounting scandals, and the Great Recession of 2008 and 2009 slowed economic growth in the U.S. to 1.9% per year over the past two decades, down from 2.6% between 1979 and 1999. Per capita GDP growth also decelerated from 1.5% to 1.0%. If the 1979-1999 trend had continued, GDP per capita in the United States would be $69,000, or $5,000 per person higher.
Even so, that slow growth trend is weighed down by the crises of the new century’s first decade. But if you just take the years since the Great Recession, a more positive trend emerges. Over the past decade, annual economic growth averaged 2.2% in the United States and accelerated to 2.8% over the past five years. Annual per capita GDP growth also accelerated to 1.8%. If these trends continue, GDP and GDP per capita in the United States will approach $34 trillion and $90,000, respectively, in 2040. Since the financial crisis ended, government reforms strengthened balance sheets for American financial institutions, households, and companies. A return to GDP per capita growth well above 1.0% in the coming years is likely (see Carin Wagner’s analysis in the GHPIA newsletter “The Big Short Part 2 Not Coming to the Box Office Anytime Soon”).
While the United States’ economy was unusually volatile during the 1999 to 2019 period, Chinese GDP shot up more than eight-fold! GDP per capita increased from $1,300 to almost $10,000. China’s rapid 11.7% average annual growth rate decelerated to 5.7% over the past five years. Without movement toward improved rule of law, China will not duplicate the stellar growth rates of the recent past. Nonetheless, still respectable growth of 4% to 5% should allow the Chinese to at least double per capita GDP by 2040.
Remember, 4% growth in China’s $13 trillion economy adds $500 billion to global GDP, whereas 12% growth in 1999, when China’s economy was $1.6 trillion, added only $200 billion to global GDP. In a quirk of math, a 2.5% economic growth rate in the United States also adds $500 billion to global GDP because our economy is nearly double China’s. Although our growth rate is slower than China’s, both countries should add an equal 0.5% or so to global economic growth in the coming years. Despite heated rhetoric and trade war uncertainties, both countries will likely prosper together in the coming two decades.
It was during the more hopeful 1990s that Russia devolved into a gangster-controlled state and its GDP fell by 60%. Economies in most of the former communist countries also collapsed, often by more than 50%. We now worry about Russia’s revived power and aggressive tendencies because its GDP rebounded from $300 billion in 1999 to $1.7 trillion today. We forget that we could not be sure who actually controlled the Russian military and its nuclear arsenal throughout much of the 1990s. Many former Soviet satellite countries now belong to the European Union, and their collective economies tripled over the past 20 years.
Although chaotic, stock markets mushroomed over the past 20 years. The total value of all publicly traded stocks on all the world’s stock exchanges increased from $35 trillion in 1999 to $85 trillion today. U.S. market capitalization increased from $15 trillion to $35 trillion, despite two 50% crashes. Globally, the number of listed companies increased from 38,000 to 43,000, even as the number of public companies in the U.S. dropped from 7,200 to 4,400. But the accelerating IPO boom since 2012 suggests the number of listed companies in the U.S. could rebound.
Over the past 20 years, the U.S. experienced terrorism, war, the worst recession since the Great Depression, and two major stock market crashes. Other world economies, currencies, commodities, and financial markets were also extremely volatile. With such events dominating the news, few noticed that American and global prosperity marched haltingly forward.
By contrast, the 20th century experienced two world wars, the Holocaust, the Korean and Vietnam wars, the Chinese Cultural Revolution, fascism, communism, and the Cold War. It was the bloodiest century in the history of mankind. And yet the 20th century ended without the current sense of economic anxiety brought to us via the 21st-century innovations of social media and instantaneous news alerts on mobile phones. Perhaps the objective facts are more positive than our perceptions of reality?
One fifth of the 21st century is now behind us. A happy, healthy and prosperous new fifth of a century to all!
Investment Insight is published as a service to our clients and other interested parties. This material is not intended to be relied upon as a forecast, research, investment, accounting, legal or tax advice, and is not a recommendation, offer or solicitation to buy or sell any securities or to adopt any investment strategy. The views and strategies described may not be suitable for all investors. References to specific securities, asset classes and financial markets are for illustrative purposes only. Past performance is no guarantee of future results.