 ,
,
January 13, 2023
For decades the 60/40 portfolio, in which an investor allocates 60% towards equity investments and 40% towards fixed income securities, has been one of the most widely adopted investment strategies. Dating back to 1980 the strategy has produced positive annual returns 35 times. In 2022, however, the average 60/40 portfolio was down more than 16%, its worst year since 2008. Decades of high inflation and rising interest rates punished bond prices last year and sent stock prices tumbling. As a result, this method of investing has come under scrutiny and sparked debate over whether it is still an appropriate risk-adjusted investment strategy. For investors currently utilizing the 60/40 approach, it may be a good time to consider a more dynamic portfolio allocation, i.e., dollar weighted modeling.
GHPIA’s dollar weighted model approach allows our clients the peace of mind that they will have adequate cash for their withdrawals through market downturns, but at the same time avoid being positioned too conservatively.
To understand the origins of the 60/40 portfolio, it is important to understand the basic concepts of Modern Portfolio Theory (MPT). In the early 1950s, Nobel Laureate Harry Markowitz proposed that the optimal portfolio should balance an investor’s risk tolerance with their desired return. To determine what this level is, he designed the Efficient Frontier (see Chart 1 below). According to the theory, an optimal portfolio offers the highest expected return for a given level of risk. Portfolios that lie below the efficient frontier are sub-optimal because they do not provide enough return for the level of risk.
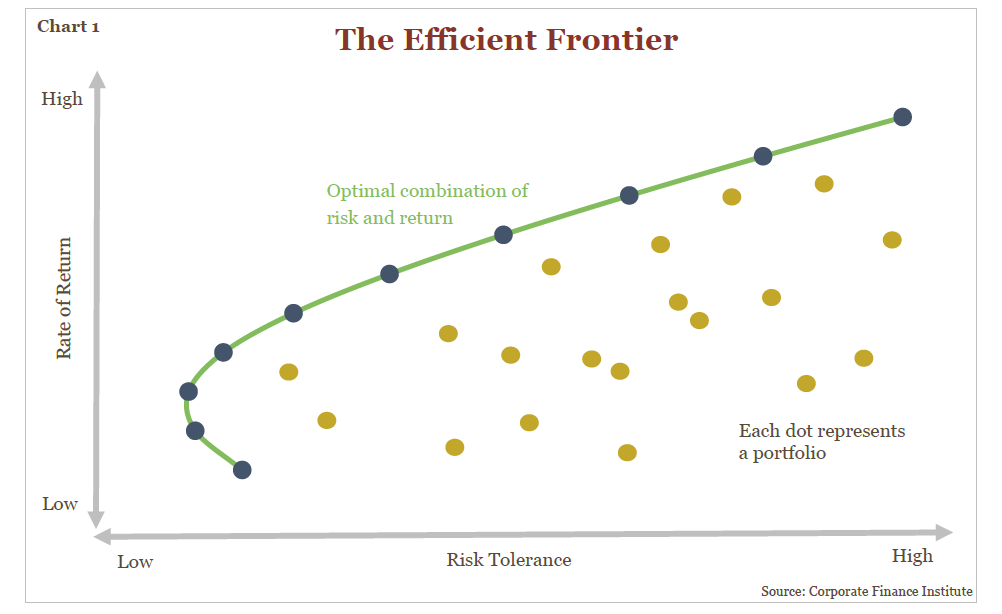
Following this theory, to achieve an optimal portfolio an investor would invest in two or more asset classes with positive returns but negative correlation (a relationship between two variables in which one variable increases as the other decreases, and vice versa). With correlation and risk tolerance in mind, a portfolio invested in 60% equities and 40% in bonds naturally conformed to the theory. But how has the traditional 60/40 portfolio performed? Should investors continue to adopt this strategy in their investment portfolios?
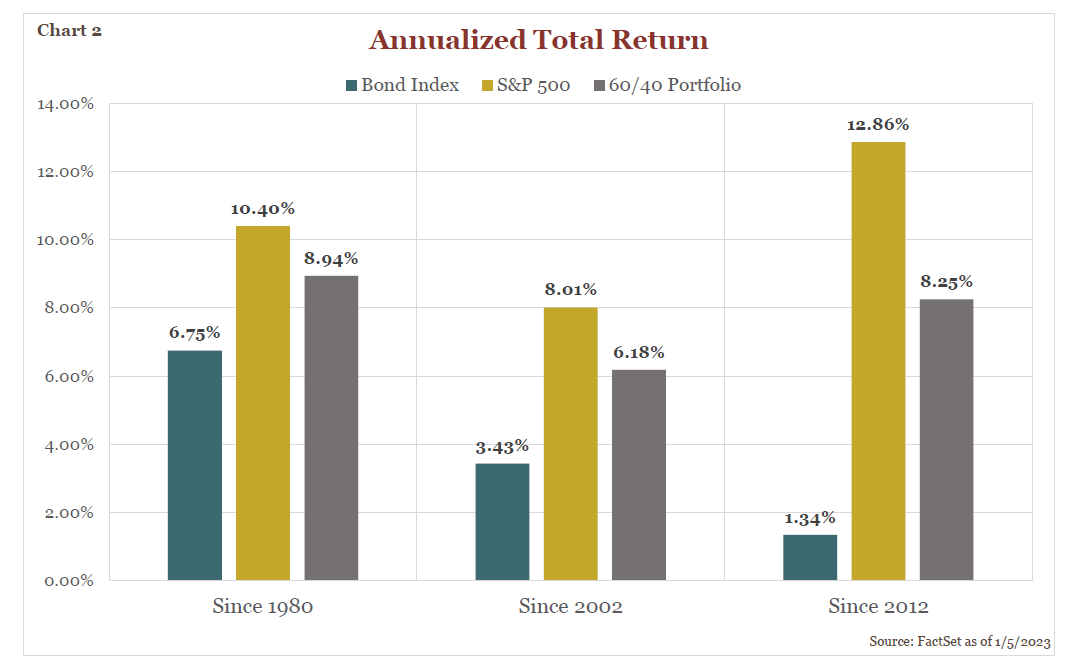
Since 1980, a portfolio invested 60% in an S&P 500 fund and 40% in a bond index fund (i.e. Bloomberg Aggregate Bond Index) would have produced an annualized total return of 8.94% (see Chart 2 below). While this is an attractive rate of return for most investors, looking at more recent history starts to tell a slightly different story. Looking back only 20 years, the average 60/40 portfolio returned only 6.18% annualized and over the past decade a 60/40 portfolio returned 8.25% annualized. In both recent time frames stocks have handily outperformed bonds as can be seen in Chart 2 below. While there are many factors driving this divergence in returns for the asset classes, key reasons have been the Federal Reserve’s dovish stance (lower interest rates), slowing economic growth trends, and lower inflation. For an investor that relies heavily on their bond portfolio for cash needs, it may have been appropriate to forgo returns in exchange for the relative stability achieved with bond investing. However, an investor that allocated 40% to bonds without considering cash needs may have been leaving significant growth on the table.
At GHPIA we strive to achieve an optimal portfolio for clients utilizing a dollar weighted model portfolio over the textbook 60/40 approach. Our methodology factors in clients’ projected cash needs rather than maintaining investments based on fixed percentages to asset classes like stocks and bonds. To determine the recommended level of cash and fixed income in a client portfolio, our financial planning team creates models and cash flow projections to help us understand the amount of cash distributions that will be needed from the portfolio over time. From there, we generally advise clients to keep five to seven years’ worth of future withdrawals in historically less risky assets like bonds, certificates of deposit, or cash. Why five to seven years?
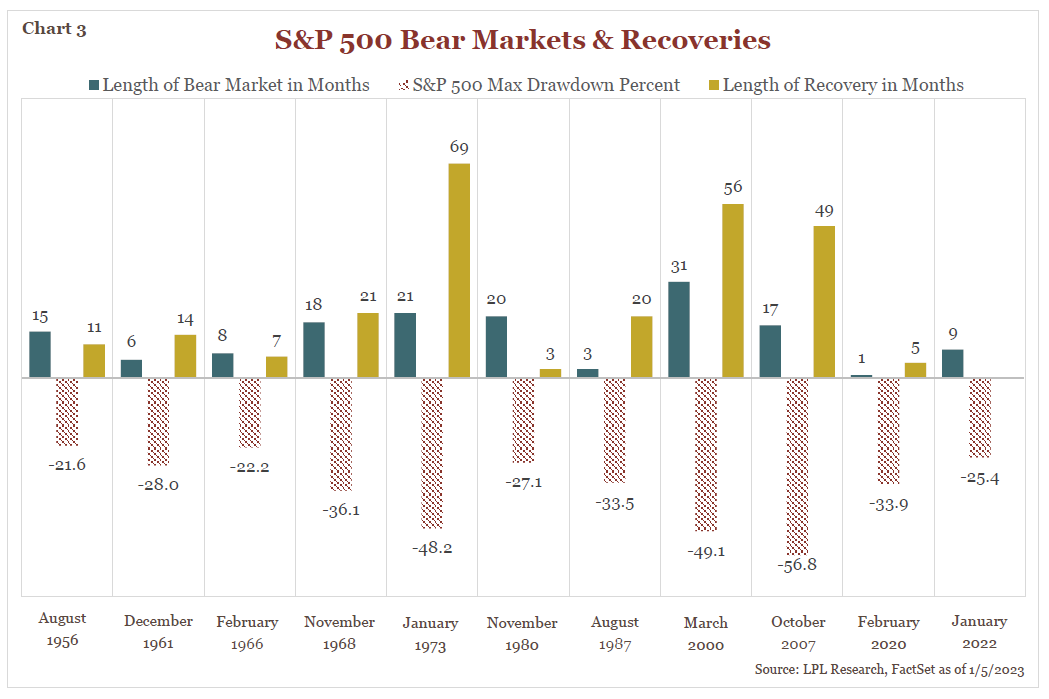
Going back to 1950, there have been 11 bear markets in which the S&P 500 declined more than 20% from its all-time highs (see Chart 3 below). On average bear markets have lasted just over one year with the stock market recovering to previous highs in just over two years. The most recent bear market during the COVID-19 recession lasted only 33 days. However, the foundation of GHPIA’s dollar weighed model is derived from the outlying periods in history. For example, the Dot-Com Bubble was the longest bear market in history for the S&P 500. It took the index 56 months (four and a half years) to recover back to its all-time high. This was subsequently followed by the Global Financial Crisis in which the S&P 500 took another 49 months (four years) to recover. This troubling time in history stresses the importance of protecting clients who are withdrawing from their portfolios in a prolonged period of market turmoil. For this reason, we feel that 10 years of client needs is optimal. However, if too much return is sacrificed relative to long-term needs, then we will default to a higher equity allocation. Five to seven years of client needs provides coverage for nearly all historical downturns, helps provide psychological comfort for clients in the event of market instability, and makes it much less likely that clients will need to sell from stocks or other growth assets while they are down.
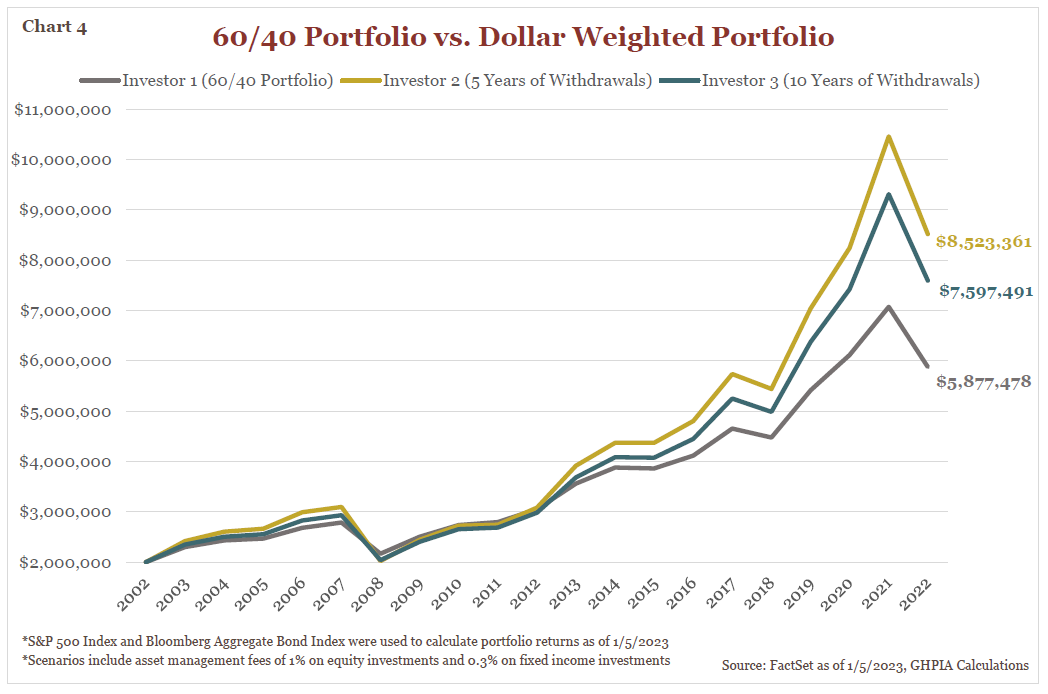
To further demonstrate a dollar weighted model approach vs. a standard 60/40 approach, let us walk through a few hypothetical scenarios for individuals that began investing 20 years ago. For simplicity’s sake we will assume all individuals start with $2 million in investable assets and expect to withdraw $60,000 a year from their portfolios. Investor 1 invested in a traditional 60/40 portfolio, $1.2 million in an S&P 500 index fund and $800,000 in a bond index. Investors’ 2 and 3 utilized a dollar weighted model with target fixed income dollar amounts. Investor 2 held five years’ worth of withdrawals ($300,000 fixed income target) in a bond index and investor 3 held 10 years of withdrawals ($600,000 fixed income target) in a bond index, with the rest allocated to a S&P 500 index fund. Both dollar weighted models held the fixed income exposure at the target dollar amounts except in years when the equity market declined (2008, 2018, 2022). In these years the investors did not sell from the equity portfolio and instead met their fixed income target when the equity market recovered.
In the case of investor 3, with the optimal ten-year cushion in case of extended stock market turmoil, they would have seen their portfolio grow an additional $1.72 million vs. the standard 60/40 approach (see Chart 4 below). A more risk tolerant individual, like investor 2, would have seen their portfolio grow by an additional $2.65 million! While past performance is not indicative of future results and the scenarios presented are not based on real individuals, we believe this illustrates the importance of thinking outside textbook approaches to investing.
Following a 60/40 portfolio may still appease some investors’ financial goals, however for many this one size fits all approach may not maximize risk-adjusted returns. GHPIA’s dollar weighted model approach allows our clients the peace of mind that they will have adequate cash for their withdrawals through market downturns, but at the same time avoid being positioned too conservatively. We frequently consider the cash flow needs of our clients, understanding that current circumstances are always subject to change, and adjust their custom portfolio models accordingly. This strategy, along with our disciplined and sustainable approach for selecting favorable investment opportunities (as described in our Q1 2021 Newsletter – How GHPIA Screens Stocks for Your Portfolio) may help mitigate the pain of bear markets and assist us in meeting investment goals.
Investment Insight is published as a service to our clients and other interested parties. This material is not intended to be relied upon as a forecast, research, investment, accounting, legal, or tax advice, and is not a recommendation, offer or solicitation to buy or sell any securities or to adopt any investment strategy. The views and strategies described may not be suitable for all investors. Individuals should seek advice from their own legal, tax, or investment counsel; the merits and suitability of any investment should be made by the investing individual. References to specific securities, asset classes, and financial markets are for illustrative purposes only. Actual holdings will vary for each client, and there is no guarantee that a particular account or portfolio will hold any or all of the securities listed. Past performance is no guarantee of future results. Investments carry risk and investors should be prepared to lose all or substantially all of their investment.