 ,
,
September 30, 2020
A year ago, the primary economic concern was the U.S.-China trade war. A Moody’s report published in September 2019 estimated it had cost the U.S. 300,000 jobs and, if escalation continued, would push the U.S., Europe, and many emerging markets into recession. Trade was taking center stage well before the world had heard of COVID-19.
Comparing imports and exports (trade) to total spending (including within borders) is a good relative indicator of the importance of world trade. According to the World Bank, total world trade in 1995 amounted to 43% of the world’s economy. In 2019, it amounted to 60%. Though the relationship between trade and the world economy is complex, the correlation is evident. Over the last 25 years, the value of goods and services crossing international borders has had an increasingly significant economic impact.
Despite current crises, the drive toward freer world trade – and the benefits it brings to nations – seems unstoppable.
It is worthwhile to reflect on how and why the globe’s economies have become so connected. Do the benefits of trade openness outweigh the consequences, or are trade wars and pandemic restrictions signaling a new era of protectionism?
Economists explain the increase in trade volume as a result of lowering trade costs. The World Trade Organization, in its 2008 Annual Report, breaks down trade costs into tariffs, non-tariff barriers, transport costs, and the costs of connecting people. Reducing these costs can be achieved by reducing policy barriers, or by innovation. The standardization of intermodal shipping containers since the 1970s and the more recent expansion of the high-speed Internet are good examples of advances in technology which significantly reduced costs and fueled trade.
While entrepreneurs work on innovating, policymakers control the remaining barriers. They typically enact policy barriers to trade either to protect or to punish. Regardless of the intent, economists generally agree that barriers are detrimental to the economies of both trading partners involved. Government leaders have the difficult job of determining the economic price their citizens should pay in pursuit of their policy goals.
The pandemic presented a transparent example of this dilemma, as governments shut down businesses and borders in the name of health and safety. The spreading virus made scale and reach scary concepts. There was little time and reliable data on which to base policy, and leaders made decisions based either on too much fear or too little. During normal times, however, scale and reach make goods and services more affordable and available, which improves quality of life for many. The formulas previously used to weigh costs and benefits of policy barriers will be applicable again when the virus is no longer a part of the equation.
The increase in world GDP over the past 25 years far exceeded the population growth. This means that the world average GDP per capita grew. In fact, it more than doubled. Of course, that extra income was not spread evenly. Rates of extreme poverty remain stubbornly high in low-income countries and those affected by conflict and political upheaval. This should not, however, diminish the remarkable accomplishments made. The World Bank estimates that the number of people living on less than $1.90 per day has fallen from almost 30% of the world’s population in 1996 to 10% in 2015.
The first chapter in a 2015 joint publication by the WTO and OECD is titled, “Why Trade Costs Matter for Inclusive, Sustainable Growth.” It concludes that, “In a distributive sense, the largest relative gains go to the countries that start with the highest levels of trade costs, i.e. developing countries, particularly in sub-Saharan Africa.” In other words, reforms that increase access to the world economy are necessary to attain a share of its prosperity.
Tariffs, direct taxes imposed on imports, are the easiest trade barriers to measure. Average tariffs around the world have fallen from 6.4% in 1995 to 2.6% in 2017. In developed countries where at least a quarter of every dollar earned is taken for income taxes, it may seem like a ~4% reduction is not much. When comparing commodity prices, however, a small difference can be quite meaningful. A gas station selling gas for $3.11 per gallon will see little traffic if a competitor across the street is selling for $2.99 per gallon. All things being equal, lower costs have the dual effect of attracting more customers and encouraging more spending.
Non-tariff measures (NTMs) take less direct forms of increasing costs but are also quantified. An example of an NTM would be administrative and bureaucratic delays at the border that add cost to imported products. Tariffs are transparent statements of foreign policy. NTMs may serve the same purpose, or politicians may deem them essential to protect intellectual property or public health and safety.
It is difficult to differentiate red-tape NTMs from essential ones. Nevertheless, we can use an index such as the Heritage Trade Freedom score, which evaluates tariffs and NTMs to identify trends in policy. A score below 50 represents polices of protectionism — highly unfavorable for businesses seeking growth from foreign markets. Unsurprisingly, developed countries with a high GDP per capita score consistently above a 70. From 1995 to 2018, before President Trump’s trade war, the average world score moved steadily upwards from a “Mostly Unfree” score of 56.7 to “Mostly Free” at 76.0 (see chart below). The trend is clearly towards free trade policy.
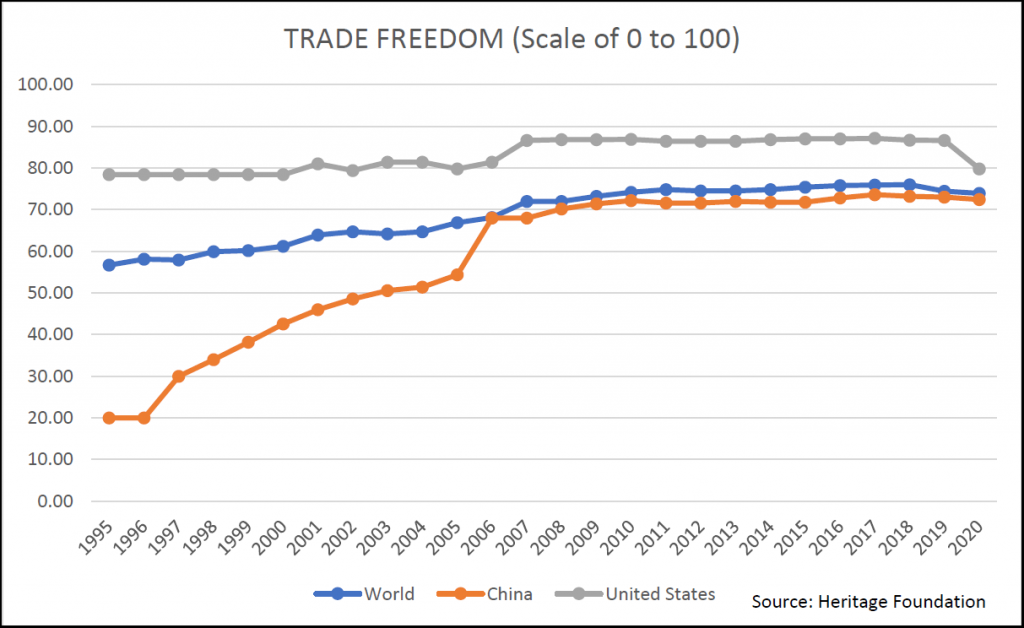
Beginning in 2018, Trump began to raise tariffs of Chinese imports to the U.S. and China retaliated. The U.S. average tariff on Chinese goods increased from 3.1% to 21.0% by the end of 2019. Average Chinese imports on U.S. goods started 2018 considerably higher, at 8.0%. By the end of 2019 they matched the U.S. at 20.9%. This trend damaged America’s Trade Freedom score. Despite the tension and drama, the U.S. remains a freer trading partner than the world average, which was hardly affected by the downgrade of the U.S. score.
China’s progress in trade freedom should not be confused with its poor political and overall economic freedom. Countries that have more oligarchic systems of governance — despite their openness to trade — pay the price in terms of their citizens’ prosperity. China, for example, has less than 16% the GDP per capita of the U.S.
Not even a doubling of current tariff rates between the U.S. and China would represent a complete unraveling of policy progress made worldwide. Advances in technology and productivity, which happen independent of policy barriers, would help offset the negative effect of tariff increases.
The economic wounds caused by the pandemic will be tender for some time. An economic recovery will require innovation from businesses and policies that support them. Citizens to whom leaders are accountable are already eager to get back to work and reclaim their livelihoods.
Those leaders will need to weigh the short-term political benefits of protectionism against the high long-term cost of implementing those trade barriers and the documented rewards of lowering them. In any case, forces toward trade freedom may be too great for decision-makers to withstand. The U.S.-China trade war, which seemed so ominous just a year ago, will appear a mere speed bump on the road to freer world trade.
The GHP Investment Advisors Quarterly Global Markets Newsletter is published as a service to our clients and other interested parties. This material is not intended to be relied upon as a forecast, research, investment, accounting, legal or tax advice and is not a recommendation offer or solicitation to buy or sell any securities or to adopt any investment strategy. The views and strategies described may not be suitable for all investors. References to specific securities, asset classes and financial markets are for illustrative purposes only. Past Performance is no guarantee of future results.