 ,
,
March 31, 2014
In 2008, with mortgage foreclosures mounting and the economy in the depths of the “Great Recession” Earnings per Share (EPS) for the S&P 500 Index tumbled to $58.32, a 31.7% decline from the pre-recession peak of $85.43 (EPS for the S&P 500 Index is the total earnings for all 500 companies divided by the total shares outstanding; please see Chart 1). Surprisingly, corporate profits rebounded very quickly as companies slashed costs and unemployment skyrocketed. By 2013 EPS reached $108.43, surpassing the 2006 peak by 26.9%. Despite a spectacular 176% gain off the March 2009 bottom, the S&P 500 Index stands only 19% above its pre-recession high.
Earnings volatility contributed to the panic, particularly in the financial industry. Since earnings are a construct of accounting rules and assumptions they overstated losses during the financial crisis. For example, accounting rules forced financial institutions to write down mortgage-backed securities (MBS) as prices collapsed during the market panic (called “Mark-to-Market” accounting), even though most MBS actually continued to make cash payments or retained collateral value. As such, cash flows were much less volatile than earnings. Cash Flow per Share for the S&P 500 Index fell 17.6% during the recession and is now 30.1% above its prior peak.
More stable cash flows despite collapsing earnings gave us confidence to maintain our stock market holdings in 2008 and 2009. Only by studying both measures of profitability – as well as balance sheet data – were we able to glean a clearer picture of corporate health than by looking at earnings alone. Even now earnings and cash flows diverge in certain segments of the market – particularly regional banks and industrial companies – due to accounting and economic effects that linger from the recession. Studying cash flow statements and balance sheets allows us to better understand some of these anomalies.

If earnings are only one way of understanding corporate profitability, then using the Price-to-Earnings (P/E) ratio as our only indicator of value could be misleading. In September 2007, just prior to the crash, the P/E ratio for the S & P 500 Index was 17.1. At its low in March of 2009, the P/E ratio for the S&P 500 Index was 11.6. It is now once again back up to 17.1. What does this number mean? Is it high or low? If the market crashed last time it reached a P/E of 17.1, then surely it must be too high – or is this an irrelevant comparison?
The arithmetic of the P/E ratio is actually very simple. If we expect a company to earn $1 per year for its stockholders, and we pay $17 per share of stock, then our return should be no less than 5.9% per year (1÷17 = .059 = 5.9%). We say “no less” because the $1 in earnings may increase if the economy grows. As we mentioned above, earnings managed to grow by 26.9% from the pre-recession peak through 2013 – an annual average of 3.3% (Of course, instead of steady annual growth, earnings and stock prices initially plummeted during the recession and then skyrocketed during the recovery). In this situation our return expectation is roughly 9.2% per year (5.9% + 3.3% = 9.2%). If future earnings growth resumes its more normal pace of 5% to 6% then our return expectation would be higher. While other factors must be considered, a P/E ratio of 17.1 is not inherently alarming.
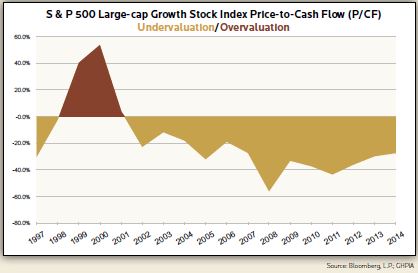
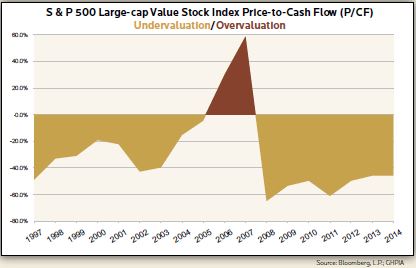
Similarly, the S&P 500 Index companies sold for a multiple of 4.4x annual cash flow at the bottom in early 2009. Therefore, this Price-to-Cash Flow (P/CF) valuation metric implied annual returns of at least 22.7% ($1 per share in annual cash flow divided by the $4.40 price, i.e. 1÷4.4 = .227 = 22.7%). In fact, the S & P 500 Index returned 22.6% per year over the past 5 years since bottoming in March 2009. Cash flow proved to be a better indicator of profitability and stock market return than earnings over the past five years of recovery. While not always as clairvoyant, cash flow is another good indicator of corporate profitability and P/CF is an important valuation tool. The P/CF ratio for the S&P 500 Index is now 9.2, implying returns of at least 10.9% depending on future cash flow growth. Once again, the P/CF data is not flashing a warning signal.
A third valuation benchmark is the Price-to-Book Value (P/BV) ratio. This metric is particularly informative for financial companies. “Book Value” is another term for “Shareholders Equity” or “Net Worth”. A company’s Book Value is equal to its assets minus its liabilities. P/BV allows us to assess the value of a company relative to its balance sheet. Beyond financial companies, P/BV can be useful for other asset intensive industries such as natural resources, utilities, or industrial companies.
Asset intensive companies with substantial fixed costs often experience more extreme earnings and cash flow fluctuations. During recessions when revenues slide even modestly, profits can plummet for these companies to either very low levels or losses. Although share prices may also plummet in response, fixed cost companies will nonetheless continue to carry very high P/E or P/CF ratios (This is just arithmetic. Any share price divided by a very low number produces a high P/E or P/CF ratio and any share price divided by a loss – a negative number – does not provide any meaningful information for valuation purposes). P/BV can be a better valuation indicator for these companies because balance sheet data is often more stable than earnings or cash flows.
Many investment professionals understand that stock valuation for financials and cyclical companies is often counterintuitive. P/E and P/CF ratios are typically very high when these stocks are “cheap” and very low when they are “expensive”. The stock market usually understands business cycles and will not reward cyclical companies with high valuations when profits are nearing their peak. During the last business cycle, however, many investors felt that “this time was different”, forgetting traditional valuation principles and thereby inflating the real estate and financial bubble. Of course, it was not different and the crash was subsequently bigger. At present, P/BV ratios are quite reasonable and also not flashing an alarm.
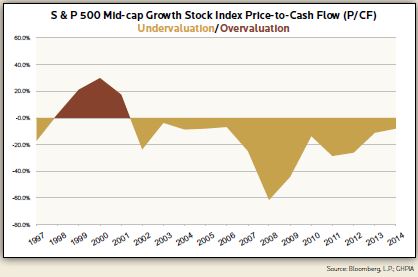
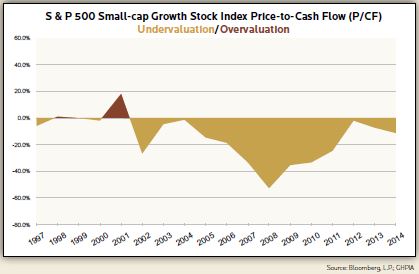
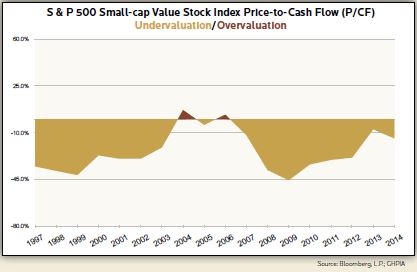
On our “GHPIA Equity Valuation Dashboard” we establish valuation benchmarks for each major equity asset class (Large, Medium, and Small Companies – and – Growth Stocks vs. Value Stocks) using all three of the valuation metrics outlined above – Price-to Earnings (P/E); Price-to-Cash Flow (P/CF); and Price-to-Book Value (P/BV). As is usual, each tells a somewhat different story, but by combining all three we get a clearer picture of stock market valuations.
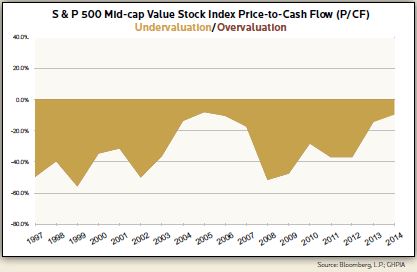
P/E ratios exceed our valuation benchmarks for Small and Mid-cap stocks, but indicate that Large-cap stocks remain undervalued. Earnings, however, appear understated relative to cash flows and book value for the Mid-cap and Small-cap stock indexes. Part of the reason for this discrepancy is because financial and cyclical companies comprise a large percentage of the Small and Mid-cap indexes. For example, financials and cyclical companies are approximately 51% of the S & P 600 Small-cap Value Index and 58% of the S & P 400 Midcap Value Index. P/CF and P/BV metrics indicate much more reasonable valuations for these segments of the stock market.
We continuously monitor earnings, cash flows and balance sheets to better understand corporate health and the broader economy. To do so requires a more sophisticated understanding of accounting and valuation rather than just a simplistic reliance on earnings alone. While the stock market will always be volatile, we do not believe stocks are currently overvalued. Nor do we believe the Mid-cap and Small-cap asset classes are overvalued despite higher P/E ratios at present. Cash flows remain robust and P/CF valuations are still reasonable.
One particular anomaly stands out for the Mid-cap and Small-cap Value Indexes. Regional banks comprise a significant percentage of these indexes, but their earnings are still quite low. Their average P/E ratio is around 22 with some as high as 45 or so, very high numbers for banks during normal times. Despite these higher P/E ratios, most continue to sell for quite reasonable P/BV ratios. Upon closer inspection regional banks continue to husband their cash and build excess capital, often investing in liquid, safe and low yielding treasury bonds or high quality mortgage securities rather than lending to business customers. This is certainly a lingering effect of the financial crisis and current Federal Reserve policy. As lending conditions improve, most of these banks will use their financial firepower to substantially boost earnings. The P/BV ratio is a much clearer indication of their true value based on their renewed balance sheet strength rather than their current meager earnings.
The GHPIA Valuation Dashboard certainly has a “check engine light” on for certain segments of the market due to higher P/E ratios. When we look under the hood, however, we see that P/CF and P/BV metrics continue to indicate reasonable valuations. Of course, we always review our benchmarks as well as current valuation metrics to determine degrees of overvaluation or undervaluation. Valuation continues to be an art rather than a science, but we utilize our dashboard to better understand when the stock market is making inappropriate judgments from the perspective of a long-term investor. At present, we think the stock market is generally undervalued with further room for appreciation over the long-run.
Investment Insight is published as a service to our clients and other interested parties. This material is not intended to be relied upon as a forecast, research, investment, accounting, legal or tax advice, and is not a recommendation, offer or solicitation to buy or sell any securities or to adopt any investment strategy. The views and strategies described may not be suitable for all investors. References to specific securities, asset classes and financial markets are for illustrative purposes only. Past performance is no guarantee of future results.
