 ,
,
September 30, 2014
Almost nightly Americans ask “How did the market do today?” Frequently, the response is to quote the day’s change in the S&P 500 Index. Does this truly reflect the overall condition of the financial markets or the U.S economy? Do the 500 stocks in the S&P 500 Index actually mirror the performance of the over 5,000 publicly traded U.S. companies? While the S&P500 Index is a useful tool for tracking market trends and gaining historical perspective, we do not believe that S&P 500 Index investing provides adequate portfolio diversification.
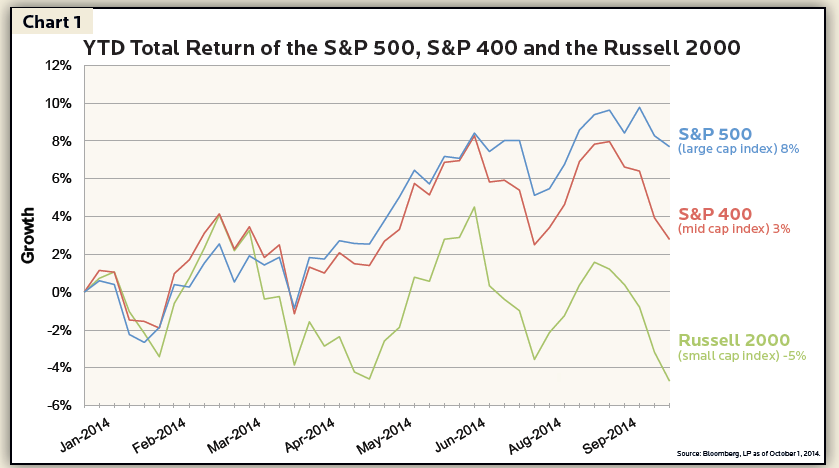
The S&P 500 Index is designed to reflect the large capitalization sector of the U.S. stock market and only includes companies with a market value in excess of $5.3 billion. While large market value is the primary criteria for the S & P 500, the S & P U.S. Index Committee also considers liquidity and industry grouping. Over the past nine months, the S&P 500 Index outperformed smaller U.S. publically traded companies (Chart 1). So why don’t all investors buy the S&P 500 Index and sit back and watch their money grow?
We believe investing should not be confined to only the largest 500 U.S. stocks. Instead we study a broad spectrum of economic fundamentals, just as any business owner would. Company size, of course, is an important consideration; but there are many other important factors such as market conditions, sensitivity to business cycles or interest rates, debt, cost structure, earnings volatility and the risk of obsolescence. These factors are frequently overlooked in selecting companies for the S&P 500 Index. For example, it was clear during the last decade that Eastman Kodak was facing the risk of obsolescence as digital and camera phones became more prevalent, but Eastman Kodak was not removed from the S&P 500 Index until 2010.
We think about diversification even more broadly than the S & P 500 Index. Our goal is to understand the composition of the economy not just the largest, most liquid stocks. Due to the focus of the S&P 500 Index on large companies, entire industries are either underrepresented or excluded from the index despite their economic importance. Think about the last time you dined at your favorite restaurant. Unless it was one of the four restaurant stocks included in the S&P 500 (Yum! Brands, Darden Restaurants, McDonalds Corp or Chipotle Mexican Grill) your purchase had no relationship to the S&P 500 Index. According to Bureau of Economic Analysis (BEA) data from 2012, Food Services and Drinking Places account for over 2% of U.S. gross economic output but restaurants account for less than 0.60% of the S&P 500 Index.
Not only does the S & P 500 Index focus on large company stocks, it compounds their influence by weighting the index according to market capitalization. Larger companies comprise larger percentages of the index. For example Apple, the largest holding in the index with a 3.5% weighting is a company with a $580 billion market value. American Express – the 50th largest holding – is just 0.45% of the index despite its $91 billion market value. Franklin Resources is ranked 200th in the index with a tiny weighting of 0.1%, but it is still a giant $32 billion market value company.
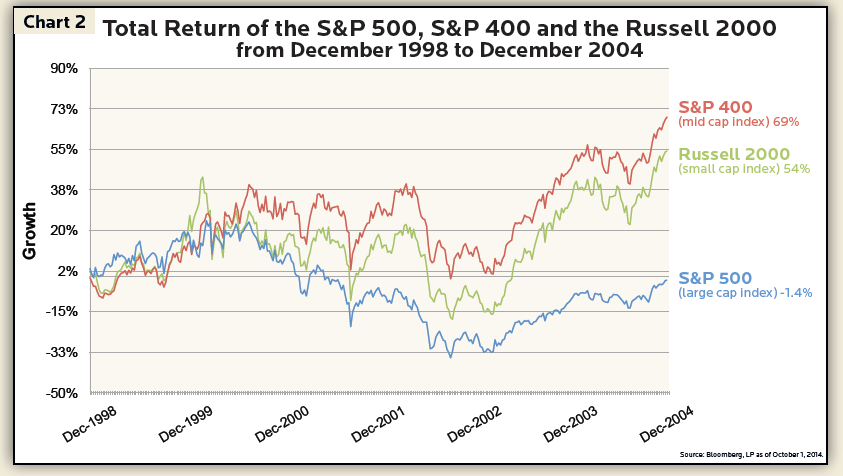
As a result of this weighting by market capitalization, 25 (5%) of the companies included in the 500 account for nearly 50% of its performance. Excessive concentration in stocks with high market valuations can lead to significant risks over time, even if an investor holds hundreds of different stocks in their portfolio. At certain points in history, a capitalization weighted approach compounded economic risks rather than diversified them. This is exactly what occurred in 1999 prior to the burst of the internet bubble. Large technology and telecom companies comprised approximately 34% of the S&P 500 Index and were selling for excessive prices. Those who owned only the companies in the S&P 500 Index experienced a nearly 50% decline in the value of their portfolios in the subsequent crash. Conversely, investors with exposure to medium and smaller sized companies produced better results during the same time period (Chart 2).
People living in areas subjected to hurricanes plan ahead for big storms. They ensure their structures are solid by buying storm windows, making a supply kit and creating an emergency plan to account for their friends and family. We invest to protect against the next big storm by owning companies with diverse reactions in changing economic conditions. We understand some of the risks companies face over time by analyzing their inherent economic building blocks such as cost structure, cyclicality and ease of substitution.
A portfolio filled with large, capital intensive, cyclical companies such as Ford, GE, Du Pont, Caterpillar, Dow Chemical, or Newmont Mining does not necessarily provide adequate protection against the next big storm. Owning a greater number of companies is better than owning fewer when it comes to diversification, but when the hurricane comes, they could all collapse due to their similar sensitivity to economic recessions. We use several layers of diversification to protect against a huge storm. We intentionally do not mirror the S&P 500 because we believe this limits diversification by concentrating excessively on the largest companies in the United States even at times when prices are artificially high. We favor portfolios allocated to a wider variety of sectors, company sizes and foreign markets.
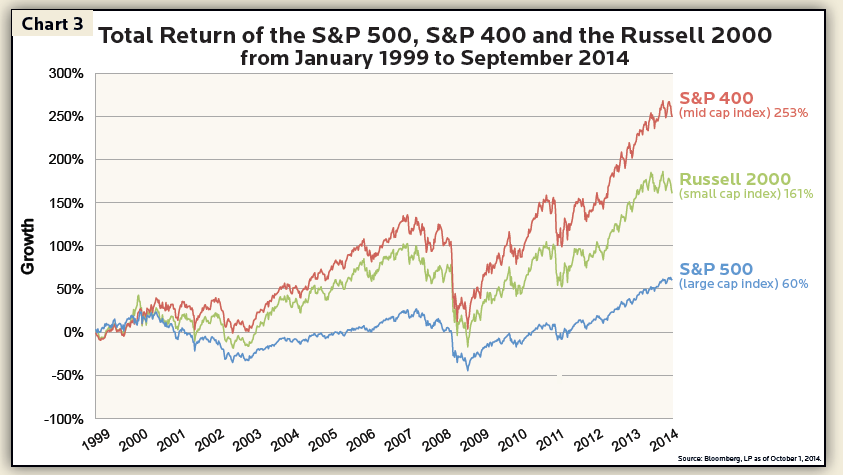
Unlike 1999, we do not believe the equity market is currently overvalued. Our analysis indicates that large capitalization companies appear to be undervalued, but so are small and medium sized companies. Recently, the S&P 500 outperformed smaller companies. In the long-run, however, smaller companies often have greater upside by virtue of their size. It is the capitalistic formula of the United States – small companies can grow to be the largest. Apple was considered a high risk small company 30 years ago and was not included in the S&P 500. Now, this small technology company has grown into a giant and accounts for over 3% of the S&P 500 index. The benefits of long-term diversification are highlighted in Chart 3. During this 15-year period, medium and small companies outperformed the largest 500 companies, and this trend of outperformance persists even when reaching back as far as the last 90 years – not just the last 9 months.
We all know you cannot judge a book by its cover and there is so much more to a story than what can be inferred by its bolded headlines. Or to put it in an even more modern context, can you really ascertain the full character and depth of a person simply by what they post each day on their Facebook wall? These notions certainly ring true when an investor considers the nightly results of the S&P 500 Index. While these surface level indicators at least provide quick and general information, as long-term investors focused on wealth creation and preservation, we must recognize there is significantly more depth and complexity to the U.S. economy and the financial markets than what is represented in this report. It is easy to quote the daily change of the S&P 500 to infer market performance, perhaps now you might pause and realize that number may not be reflective of the entire market, the U.S. economy or the companies you own in your portfolio.
Investment Insight is published as a service to our clients and other interested parties. This material is not intended to be relied upon as a forecast, research, investment, accounting, legal or tax advice, and is not a recommendation, offer or solicitation to buy or sell any securities or to adopt any investment strategy. The views and strategies described may not be suitable for all investors. References to specific securities, asset classes and financial markets are for illustrative purposes only. Past performance is no guarantee of future results.