 ,
,
September 30, 2018
This August the S&P 500 Index set a record for the longest uninterrupted bull market rally at 9.5 years and counting. The extraordinary rally dates all the way back to March 9th, 2009 when panic proliferating from the Financial Crisis hammered the index to the rock bottom low of 676. The index is now approaching 3,000, boasting astounding gains of over 300%, and has technically averted a bear market setback for the entire 9.5-year record setting rally. Of course, all good things must come to an end, or at least take a break, which adds to the necessity of historical perspective when formulating a successful long-term investment strategy. While uninvited bear markets have so often crashed the bull market party, there are a few recent examples when the bulls have thrown the bears out and kept on dancing.
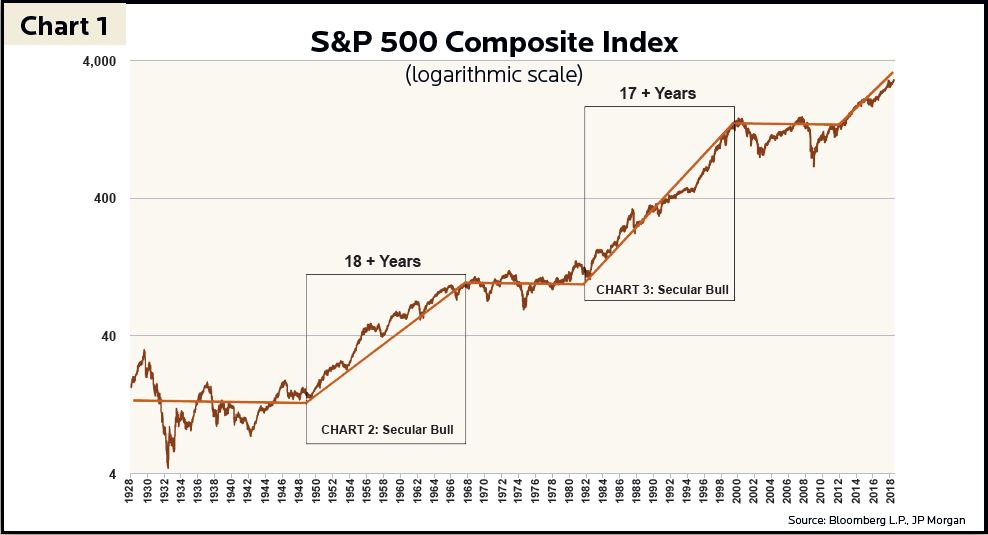
The term “secular” in financial parlance refers to market events occurring over the long-term, usually 10 years and longer. In other words, a secular bull market trend is resilient and prevails over occasional shocks by recovering losses and posting additional gains beyond whatever short-lived bear markets it may encounter. A bear market is characterized by a drop of 20% or more in stock prices in a relatively short period of time. Over the last century stocks have experienced two very impressive secular bull markets. The first lasted over 18 years spanning from June of 1949 until November of 1968, while the second was nearly as lengthy beginning in August of 1982 and lasting until March of 2000 (see Chart 1). While these two secular bull markets generated whopping price returns of over 770% and 1,300% respectively, they each encountered their fair share of bear market setbacks yet prevailed onward to produce additional gains. The following is a summary of these bear market interlopers that interrupted the secular bull markets of the last century.
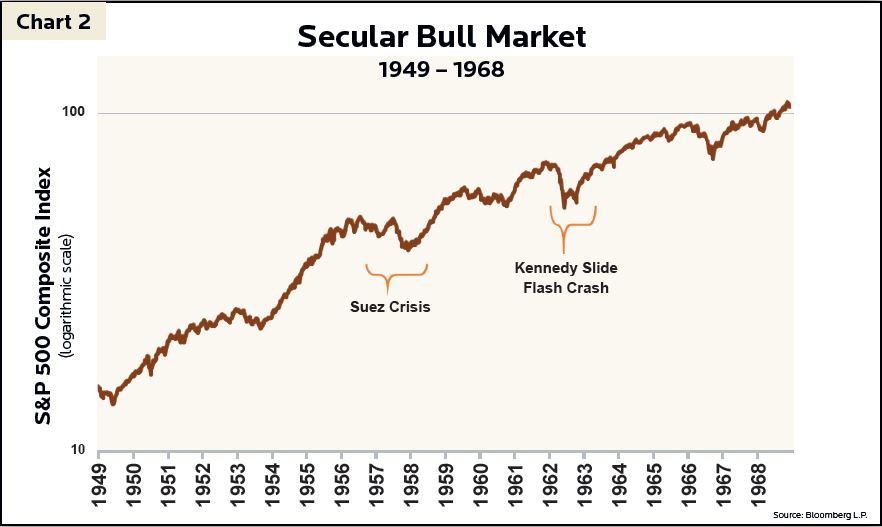
In the summer of 1956, the Egyptians moved to nationalize the Suez Canal which was formerly leased by the British. In response, Britain, France and Israel invaded Egypt with the aims of retaking the canal. The Soviet Union, eager to gain strength in the Middle East, aligned with Egypt by condemning the invasion and threatening nuclear strikes in retaliation. Ultimately, t he U.S. and President Eisenhower intervened diplomatically by both warning the Soviets to cease their nuclear rhetoric and admonishing Britain, France and Israel to withdraw from Egypt. Eisenhower’s approach effectively kept t he Soviets from joining t he conflict and all countries withdrew from Egypt by early 1957. Global tensions further intensified during this period as the Soviets would later invade Hungary as well as launch Sputnik. Stocks were rattled considerably by these geopolitical events. However, the post-WWII secular bull market rally regained its footing by 1958 and would reward investors well into the next decade (see Chart 2).
Geopolitical tensions were likewise festering in the early 1960s with the Bay of Pigs Invasion in April of 1961 and the Cuban Missile Crisis of October 1962. However, the bear market of 1962 was primarily triggered by investor reaction to President Kennedy’s attack on U.S. Steel and by the bubble in “tronic” stocks. After a huge rally for stocks in the 1950s, strong economic growth continued into the early 1960s. In the spring of 1962 President Kennedy attempted to influence corporate wage and price policy by brokering a contract between U.S. Steel’s CEO, Roger Blough, and the United Steelworkers (USW) union. Kennedy’s aim was to keep a lid on inflation by preventing an increase in steel prices. Within a few days of announcing an agreement had been reached to avoid an increase to steel prices, the rather duplicitous Blough would renege on the deal and U.S. Steel raised its prices. This set off a contentious public battle between Kennedy and the major steel companies, which ultimately ended with Blough capitulating by rolling back prices to improve “relations between business and government.” Nevertheless, the battle shook investor confidence, setting the stage for a “Flash Crash” in the weeks that followed.
Like the dot-com stocks of the 1990s, the early 1960s enjoyed an IPO boom for new-age electronic stocks. If a stock’s name ended with “tron” or “onics”, there was a good chance this rubric alone stoked investor intrigue and excessive valuations. Even enduring tech stocks like Texas Instruments and Polaroid carried P/E ratios well beyond 100, and IBM shares, for example, enjoyed a 50% rally in 1961. As stocks began reeling in early 1962, on May 28th a flash crash ensued with the S&P 500 experiencing its worst single day loss since the Great Depression. While “tronic” stocks suffered the worst losses, the entire S&P 500 would fall by nearly 28% that summer as investors soured to what appeared to be a very unstable market edifice, geopolitical tension and presidential-corporate leadership hostility. And yet, the secular bull market that rose from the depths of WWII once again proved resilient as stocks would turn upward by October 1962 and climb over 100% into the late Go-Go 1960s (see Chart 2).
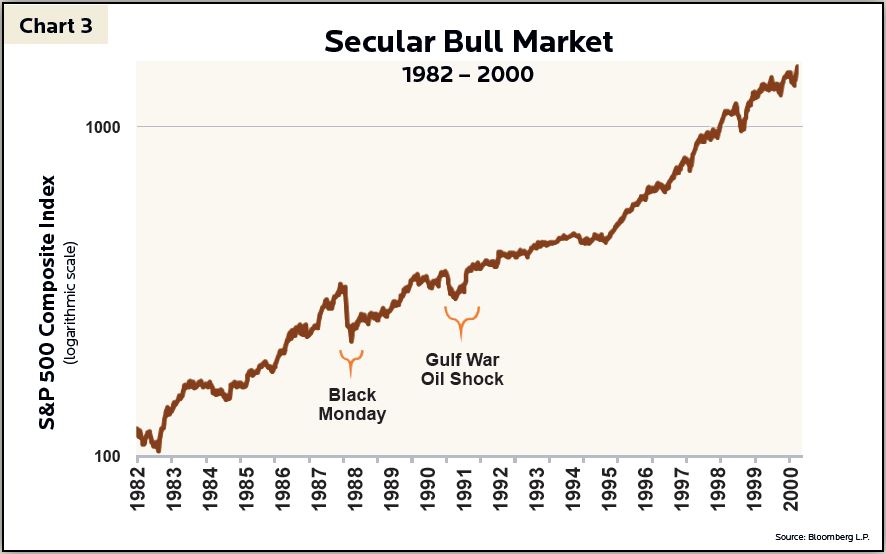
The S&P 500 suffered its worst one-day loss in history by falling more than 20% on “Black Monday”, October 19th, 1987. Stocks rallied over 200% during the bull market that began earlier in the decade and the first half of 1987 likewise enjoyed surging stock prices. The subsequently swift and panicked selling during the October collapse was triggered by a confluence of factors. From a fundamental perspective, interest rates, only a few years removed from record highs, were back on the rise. Congress was floating the idea of a merger-tax which threatened to pour cold water on a very hot mergers-and-acquisitions market. Further, there was a threat of U.S. dollar devaluation issued by the U.S. Treasury Secretary which was upsetting currency markets. Even Mother Nature played a role with a violent storm that closed financial markets in London on the Friday before Black Monday.
However, the worst of the selling was due to “program trading” for portfolio insurance and index arbitrage. In short, these computerized hedging techniques provide an excellent case study into the perils of exotic portfolio trading tools theoretically devised to reduce risk but proven disastrous in practice. In response to this crash, the SEC implemented trading curbs to reduce excessive volatility caused by computerized program trading. Despite the massive fallout from Black Monday, stocks quickly began to recover by December 1987, and the epic secular bull market of the 1980s would charge into the 1990s (see Chart 3).
The only other brief interruption to the secular bull market of the 1980s and 1990s arrived during the summer of 1990. The lofty economic growth achieved in the 1980s began to soften as the Fed raised interest rates from 1988-1989. The savings-and-loan crisis was also in full swing to the detriment of a previously strong real estate market. However, the most destructive blow for stocks was rendered by an oil price shock which occurred when Iraq invaded Kuwait setting off the Gulf War. Only a few years removed from the oil shocks of the 1970s, investors and consumers were fraught with trepidation whenever potential disruptions to oil supplies arose. Within weeks of Saddam Hussein’s invasion, oil prices more than doubled, stocks tumbled 20% and a mild recession ensued. However, it was not long until the secular bull market prevailed as stocks rebounded by year-end, and what followed was one of the most prosperous rallies for stocks in U.S. history (see Chart 3).
Regardless of the strength and duration of a secular bull market, these varied bear market disruptions prove markets are historically messy and unpredictable, which requires investor fortitude. Even the current 9.5-year bull market for the S&P500 came within inches of an official bear market in the summer of 2011. While not technically a bear as the market only dropped 19.4% in reaction to the downgrading of the U.S. debt rating and the ongoing European Debt Crisis, this was yet another event that shook fragile investor confidence, only a few years removed from the Financial Crisis. And like many recoveries from bear markets, stocks ended 2011 in positive territory and five of the following six years would handsomely reward steadfast investors with double digit percentage returns.
Our analysis of continued macro-economic stability in the U.S., coupled with robust corporate earnings, poses a rather optimistic landscape for stock investing. The frequency of bear markets, however, necessitates prudent portfolio allocation strategies built to persevere through these shocks. It is quite possible stocks are staging another secular bull market after languishing through the “lost decade” that preceded this current 9.5-year rally. However, whether it is nuclear threats, flash crashes, rising interest rates, conflict in the Middle-East, presidential overreach, or computerized trading – even the strongest bulls can be felled, if only temporarily, by a bear. Accepting this repetitive stock market theme allows successful long-term investors to remain calm so they may reap the profitable rewards that so often follow a bear attack.
Investment Insight is published as a service to our clients and other interested parties. This material is not intended to be relied upon as a forecast, research, investment, accounting, legal or tax advice, and is not a recommendation, offer or solicitation to buy or sell any securities or to adopt any investment strategy. The views and strategies described may not be suitable for all investors. References to specific securities, asset classes and financial markets are for illustrative purposes only. Past performance is no guarantee of future results.