,
September 30, 2015
One of the major causes of stock market volatility in the third quarter was concern about economic problems in China spilling over into other emerging markets and the broader global economy. Fears mounted as China devalued the yuan by 2% on August 10th. American politicians quickly denounced China’s currency “manipulation”. In fact, China pegs its currency to the dollar allowing it to APPRECIATE alongside the dollar relative to most other currencies.
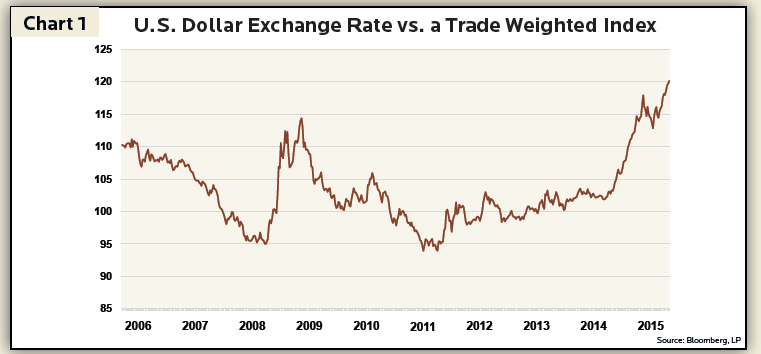
Contrary to the expectations of many people who worried about a collapsing dollar as the Fed “printed money” through its Quantitative Easing policies, the dollar is actually quite strong. The Trade Weighted Dollar Index in Chart 1 includes our 25 largest trading partners (both exporters and importers). The biggest weightings on the index include Europe at 23.5% (16.4% for Eurozone countries), China at 21.3%, Canada at 12.7% and Mexico with an 11.9% weighting.
The following charts help put the Chinese currency into perspective. The blue line on Chart 2 tracks the value of the Chinese yuan in relation to the U.S. dollar. As you can see, the yuan is down less than 5% against the dollar since 2013. The red line on Chart 2 tracks the Chinese yuan compared to the euro. Since China pegs the value of its currency to the U.S. dollar this means the yuan gained in value vs. the euro just like the dollar.
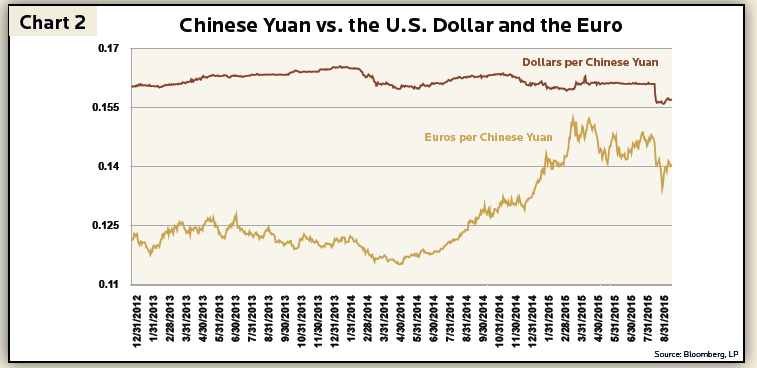
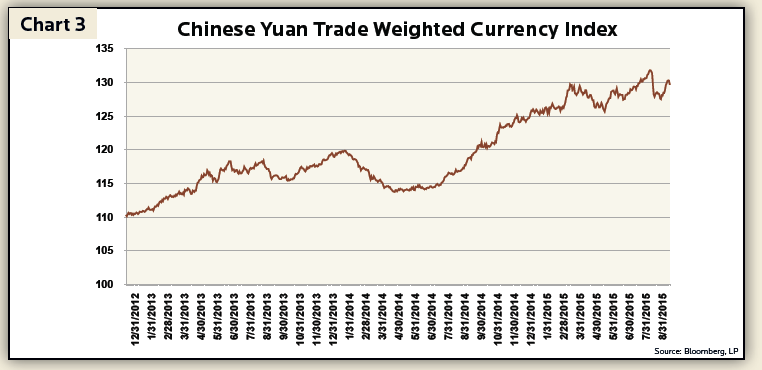
Chart 3 shows China’s currency gained substantially in value relative to its major trading partners over the past several years.
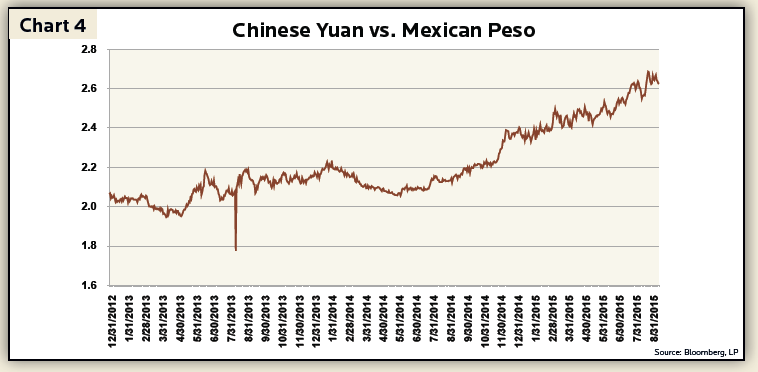
Rather than allowing the yuan to depreciate in order to gain advantages for Chinese exporters, China pursued a rather strong currency policy. A specific example is Mexico which is one of China’s biggest competitors for manufacturing exports to the United States. Chart 4 illustrates the Chinese yuan’s 27% gain vs. the peso over the past 3 years.
As one would expect, China’s strong currency hurt exports in recent quarters and contributed to slower Chinese economic growth. China maintained its strong currency policy even as other economic sectors slowed down as well, particularly construction. Construction spending grew by 5.1% in the year through June 30, 2015 vs. 10.6% in the prior year. China’s declining imports of certain raw materials such as copper and steel indicate construction activity might slow further or even decline. Despite declining construction and manufacturing exports, other areas of economic activity remain robust in China such as personal consumption and services.
In the past Chinese policymakers might have compensated for reduced construction and manufacturing growth with export stimulus through a devalued yuan. At present, however, China understands it must rebalance its economy away from cheap labor-intensive manufacturing toward consumption, services and higher value-added industries. One method to accomplish this objective is to maintain a stronger currency relative to other low labor-cost emerging market countries.
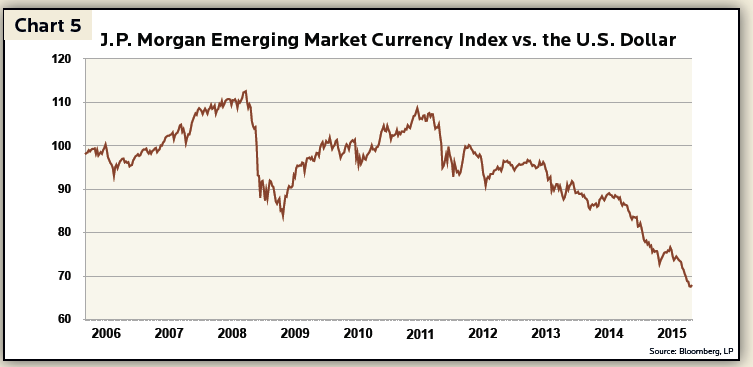
In recent quarters other emerging market countries experienced an economic shock as the U.S. dollar appreciated and the Chinese economy decelerated. Chart 5 tracks the almost 40% decline in emerging market currencies since 2011. The index in Chart 5 is a basket of 10 emerging market countries including Brazil, Chile, China, Hungary, India, Mexico, Russia, Singapore, Turkey and South Africa. Commodity exporting countries experienced the biggest declines. For example the Brazilian real and the Russian ruble are down nearly 60% while the South African rand declined 50% since 2011.
Currency declines of this magnitude stimulate inflation in these countries and increase their foreign debt burdens, but cheaper currencies also encourage companies to move production away from China. Many fear China will eventually succumb to these global economic pressures by substantially devaluing the yuan to restore its export competitiveness. The recent financial market turmoil conjured images of a 1930’s style beggar-thy-neighbor currency war ignited by China (now the second largest economy in the world).
Exports are very important to China, accounting for 22% of its GDP (almost double the share of exports in the U.S. economy). Their percentage of the economy is shrinking, however, from a high of 35% in 2006. Meanwhile China retains certain cost advantages despite the global currency pressures. In addition to falling commodity prices, most of which China imports, China retains world-class export infrastructure that is not easily or quickly replicated elsewhere. Modest devaluations of its currency should allow it to maintain cost competitiveness with other emerging market countries for a number of years.
The Chinese government emphasizes political stability and economic growth. Sometimes these two objectives conflict with each other, in which case political stability usually takes precedence. In the past the Chinese government put the brakes on economic growth when inflation accelerated. As in most countries, inflation can be quite destabilizing. Massive currency devaluation might improve export performance, but it would likely come at the cost of accelerating inflation and not much help to the overbuilt construction sector. As such, a Chinese led currency war seems unlikely.
The strong U.S. dollar is reordering economic relationships around the world. Looking at the situation solely from our perspective, however, might blind us to the fact that China has also pursued a relatively strong currency policy. The yuan’s strength is most evident when compared to the currencies of other emerging markets. As emerging market currencies collapsed, China maintained rough parity with the U.S. dollar. In the face of tremendous pressure, China opted to devalue its currency by a modest 5% over the past two years. China will likely continue this policy of modest devaluation, but is unlikely to spark a global currency war even if the dollar continues to strengthen. Once again financial market worries are justified, but perhaps overblown.
Investment Insight is published as a service to our clients and other interested parties. This material is not intended to be relied upon as a forecast, research, investment, accounting, legal or tax advice, and is not a recommendation, offer or solicitation to buy or sell any securities or to adopt any investment strategy. The views and strategies described may not be suitable for all investors. References to specific securities, asset classes and financial markets are for illustrative purposes only. Past performance is no guarantee of future results.