March 31, 2018
Stock market downturns can be worrisome, especially when they are abrupt or sharp. Last year was a unique year leaving investors accustomed to a calm, smooth stock market. The S&P 500 Index returned an impressive 22% with the least volatility since the financial crisis bottom in March 2009. The first few weeks of 2018 were subdued like 2017, but things have since shaken up. Recent market volatility may startle investors, but it is important to understand its origin and take a historical perspective. Volatility does not necessarily signal a time to sell out of the market; in contrast, it can provide new investment opportunities.
The stock market started 2018 with a rush of optimism from tax cuts, an oil price rally, and an evaded government shutdown. In early February, the Bureau of Labor Statistics released the January Employment Situation Report (“Jobs Report”) announcing 2.9% hourly wage growth. This met economists’ expectations and marked the highest level of wage growth since 2009. Despite the optimistic Jobs Report, many investors saw potential for the Fed to raise interest rates faster than previously expected to prevent the economy from overheating and curb excessive inflation. Investors began selling stocks based on these fears, resulting in a hasty 6% decline in the S&P 500 Index. Ups and downs persisted the rest of the quarter. Markets reacted negatively to the Trump administration’s initial trade tariff proposal. Stocks rebounded intermittently due to strong company earnings and robust 2018 earnings expectations. The market rallied after the February Jobs Report announced wage growth slightly lower than expectations and an uptick in the labor force participation rate. News that might not have moved the market in 2017 often affected stocks sharply in the first few months of 2018. The market is more volatile than last year, but how do the last few months of volatility compare to years prior to 2017?
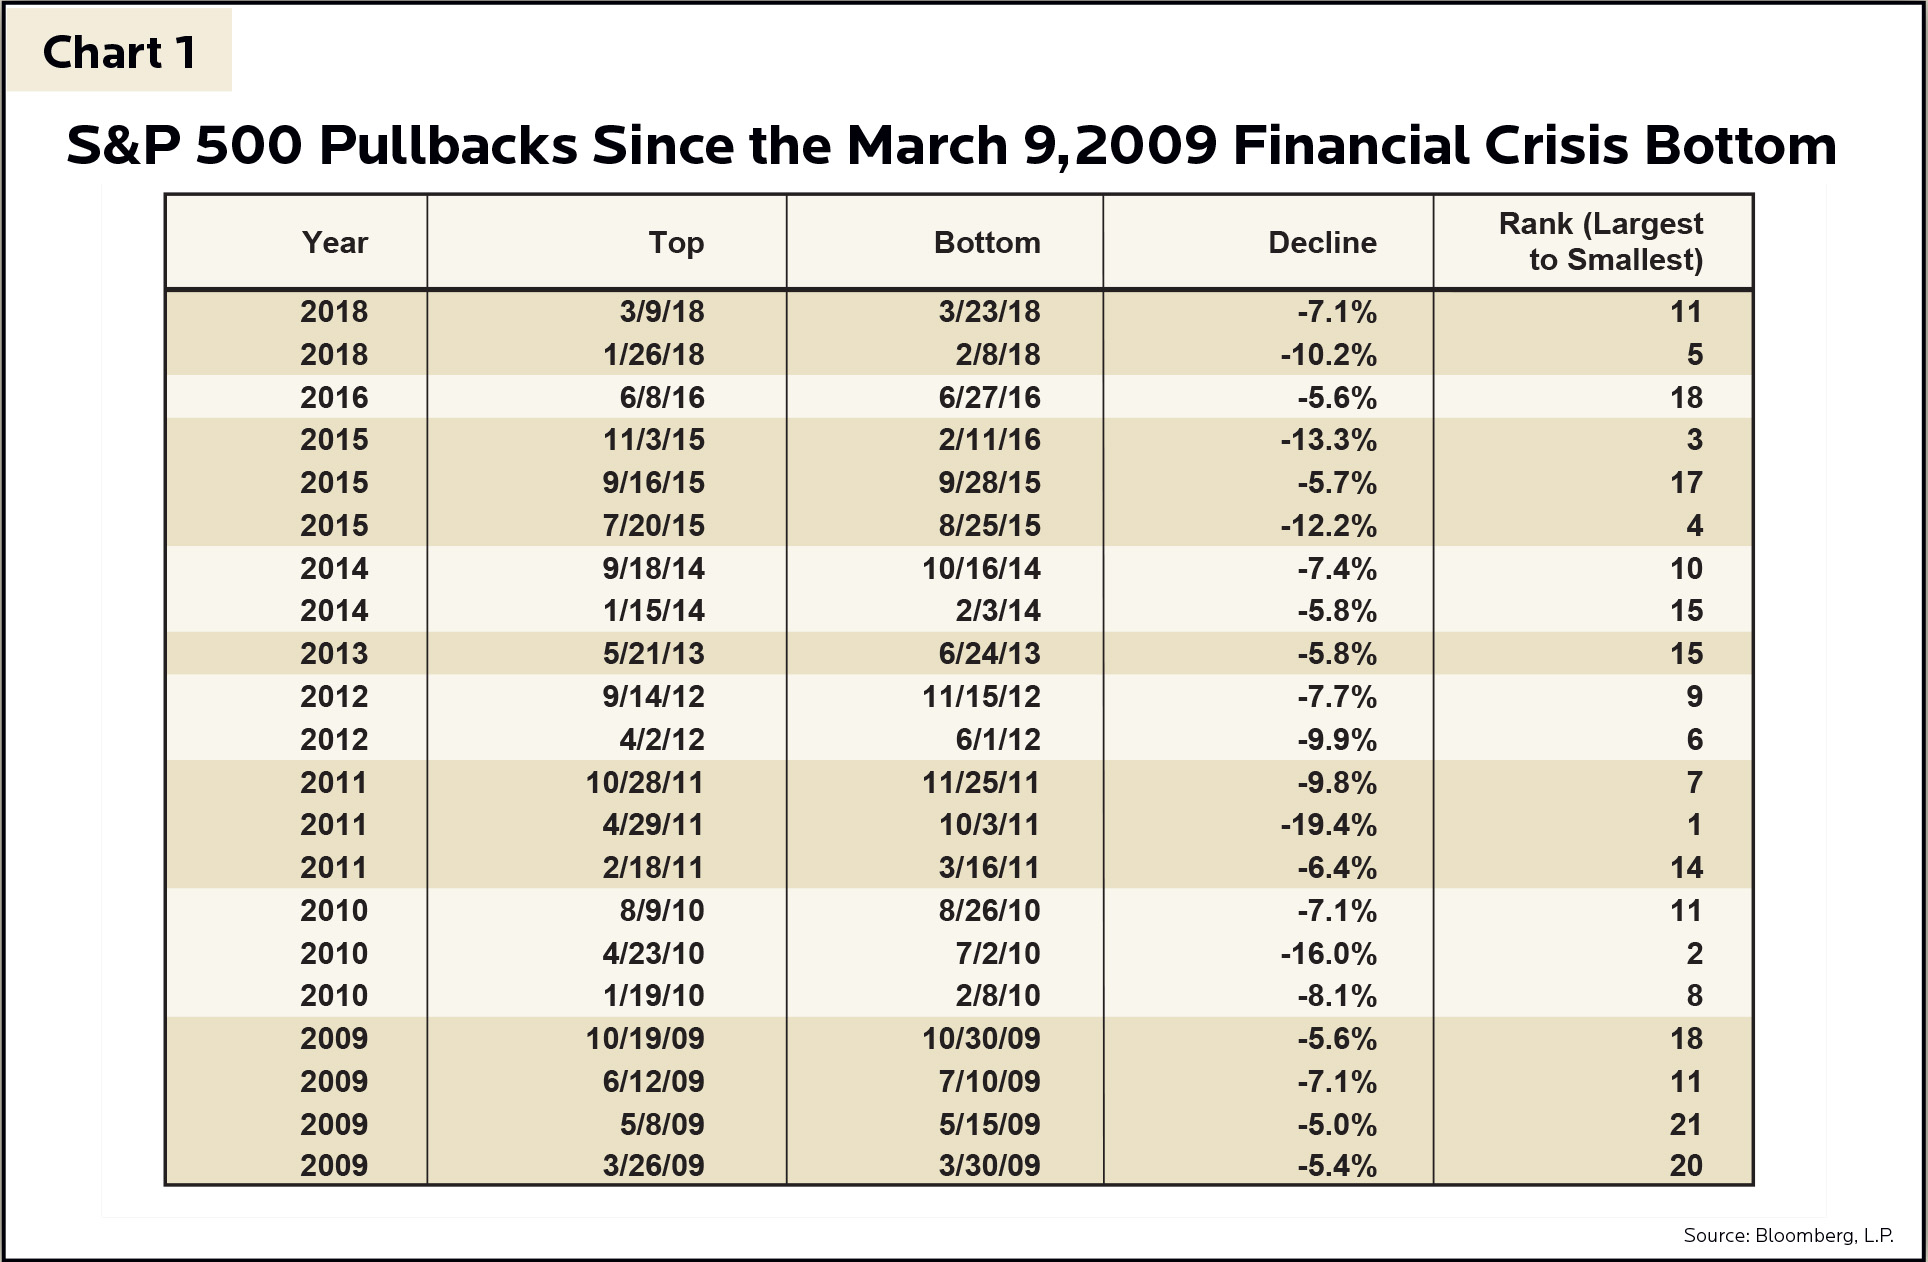
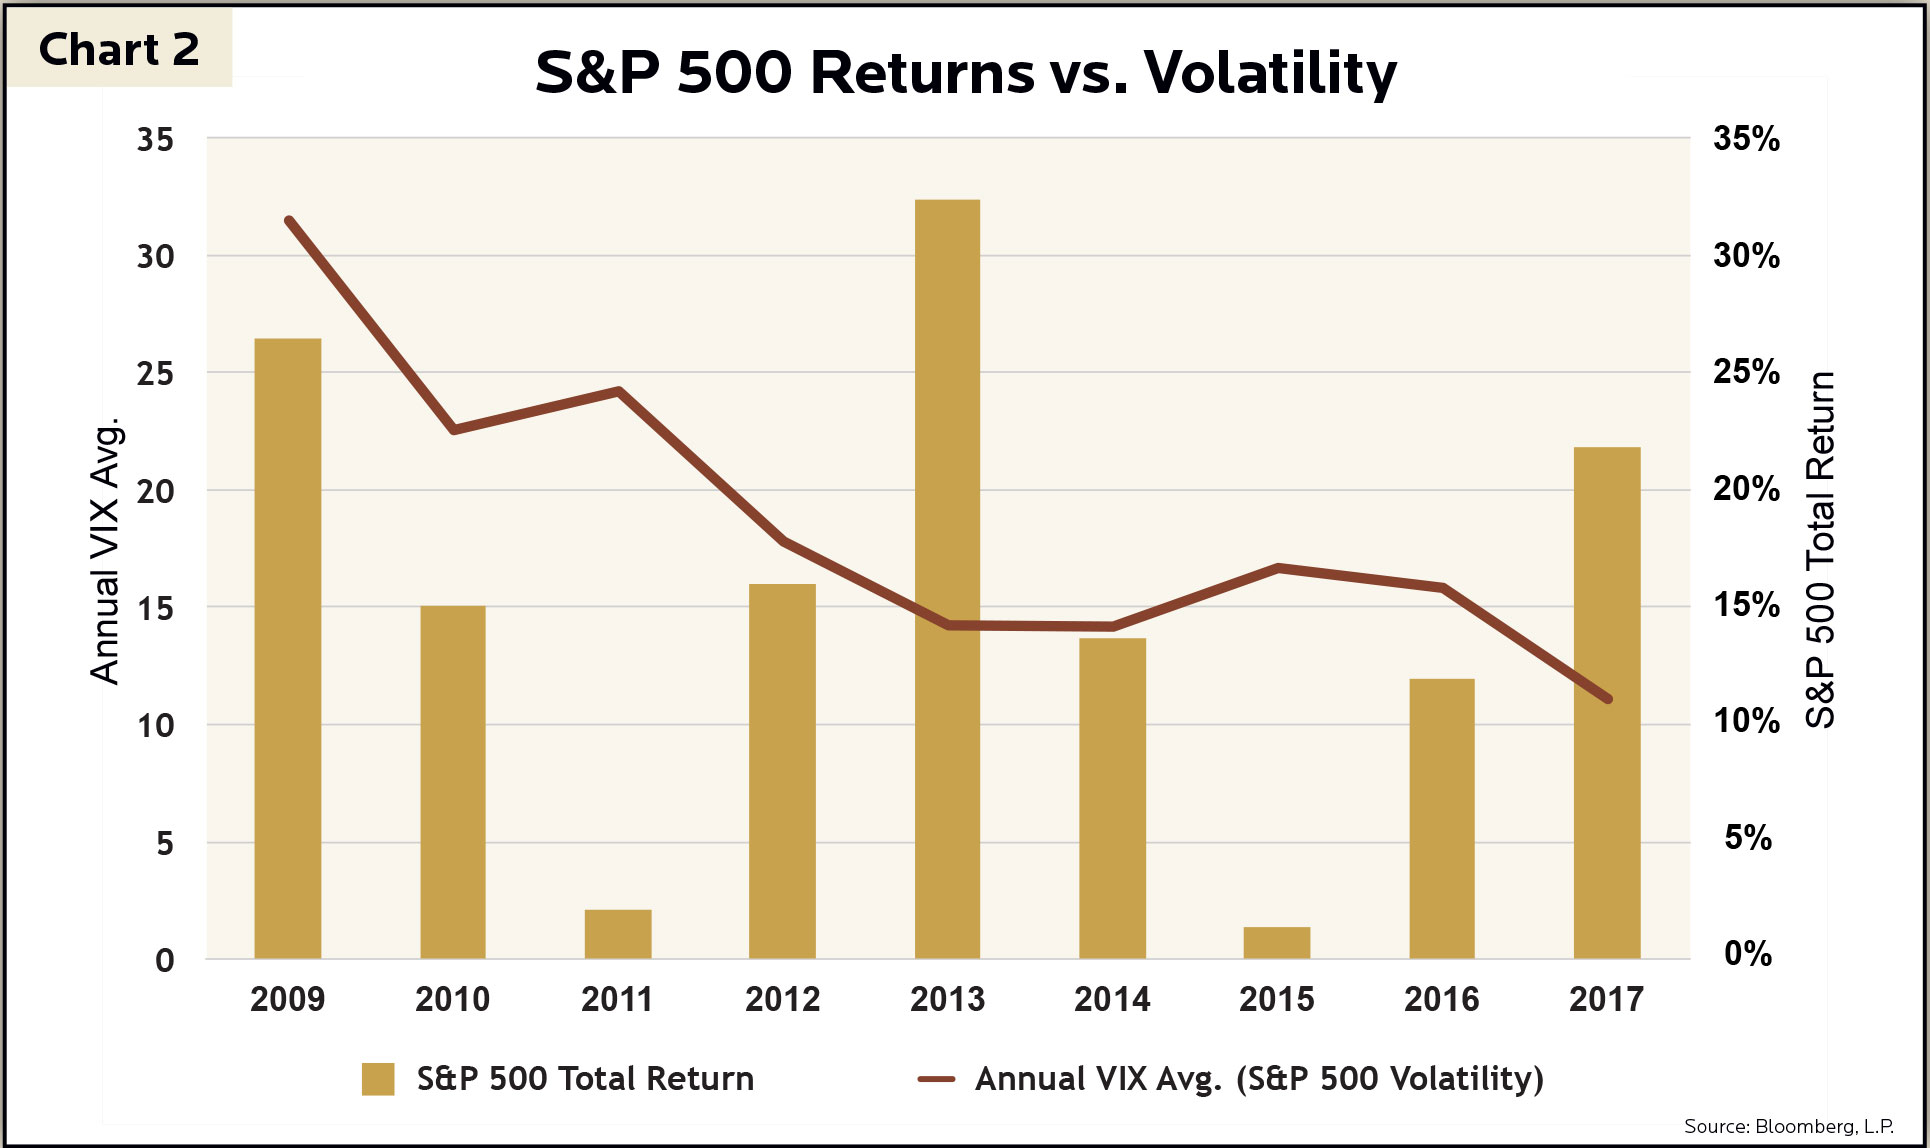
Since the stock market trough of the financial crisis in March 2009, the S&P 500 Index declined 5% or more twenty-one times, but not once in 2017 (chart 1). The Chicago Board Options Exchange Volatility Index, commonly known as the VIX Index, captures stock market volatility based on fears of a market downturn. The daily average of the VIX from 2009 through 2017 was 41% higher than in 2017 (chart 2). The VIX averaged 17 through the first quarter of 2018, which is in-line with the average since the financial crisis. The recent 10.2% dip in early 2018 felt significant, but note there have been four larger pullbacks since the 2009 bottom. Furthermore, stock market volatility is not necessarily correlated with weak market returns. Four pullbacks occurred in 2009 alone, yet the S&P 500 Index still returned 26% for the year. In 2013 and 2014, volatility as measured by the VIX was equal, but the S&P 500 returned 18% more in 2013.
While understanding the origin of stock market volatility is important, fundamentals such as company earnings and valuation metrics are also essential. At GHPIA, we invest in companies based on their long-term potential. We look for undervalued stocks that demonstrate healthy and steady profits, as well as strong balance sheets with reasonable debt levels. If the entire stock market sells off 10% while company fundamentals remain intact, investors have an opportunity to invest new funds at a 10% discount.
Additionally, selling during volatile periods presents significant risk to investors. Consider when the S&P 500 Index declined 16% in 2010. If an investor got nervous and sold at the very bottom of the pullback and reinvested less than two weeks later, their return for the year would have been almost 7% less than an investor who stayed invested. While an isolated 7% underperformance in a year may seem significant, compounding annual returns further amplifies the effect. If an investor had $1,000,000 in the S&P 500 on January 1, 2010 and stayed invested, their investment would have grown to $2,834,910 by the end of 2017; however, the nervous investor that took their money out for a couple weeks in 2010 would only have $2,670,820 at the end of 2017 – a difference of over $164,000!
In early February, CNN published an article after the stock market closed titled “Dow plunges 1,175 – worst point decline in history”. With headlines like this, it is understandable why market participants become anxious and feel they must do something with their investments, but this is often when doing nothing is a better move. What the CNN article left out is the 1,175-point decline for the Dow amounted to a dip of 4.6%, which only ranks as the 112th largest decline on record – not so bad when you look at it that way. Objective thinking, removing emotions, and sifting out the noise are key components to wealth management. At GHPIA, we take a long-term, holistic view of stock market events and invest in a rational, thorough manner so our clients can achieve their long-term goals.
Investment Insight is published as a service to our clients and other interested parties. This material is not intended to be relied upon as a forecast, research, investment, accounting, legal or tax advice, and is not a recommendation, offer or solicitation to buy or sell any securities or to adopt any investment strategy. The views and strategies described may not be suitable for all investors. References to specific securities, asset classes and financial markets are for illustrative purposes only. Past performance is no guarantee of future results.
