The theme of GHP Investment Advisors’ 2023 Economic Outlook Forum on May 10th was “Short-term Pitfalls, Long-term Prosperity”. The advisors at GHPIA discussed the impact inflation is having on capital markets, key themes in equity and fixed income markets and U.S. government debt. Below is a detailed summary of each topic.
Inflation – Beyond the Peak: Examining Inflation’s Trajectory and Implications
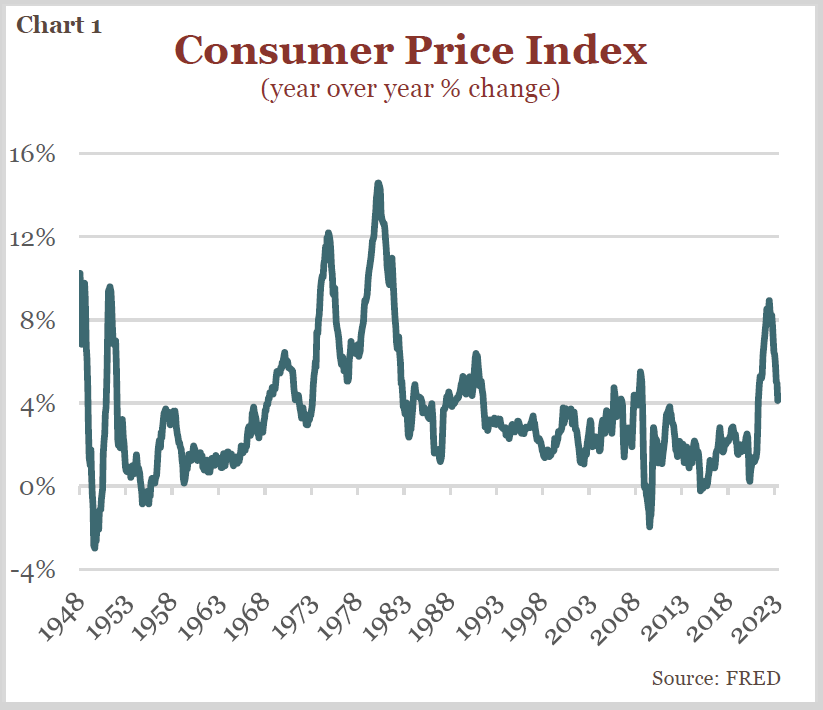
- Over the past year inflation, measured by the Consumer Price Index, reached levels not seen since the late 1970s (see Chart 1).
- Fortunately, we are moving towards price stability once again, but likely will not be returning to pre-pandemic price levels.
- The 1970’s saw a wage price spiral, where rising wages led to increased production costs and price increases. The cause of today’s inflation is excessive government stimulus and global supply chain disruptions.
Inflation Causes – Demand Side
- To replace lost income due to shutdown mandates during the pandemic, the U.S. government provided $5 trillion in stimulus to households and businesses. This amount proved to be excessive as personal savings soared. As of April 2023, we estimate households still have $700 billion in excess savings, well below the $2.1 trillion peak in August 2021 (see Chart 2).

Inflation Causes – Supply Side
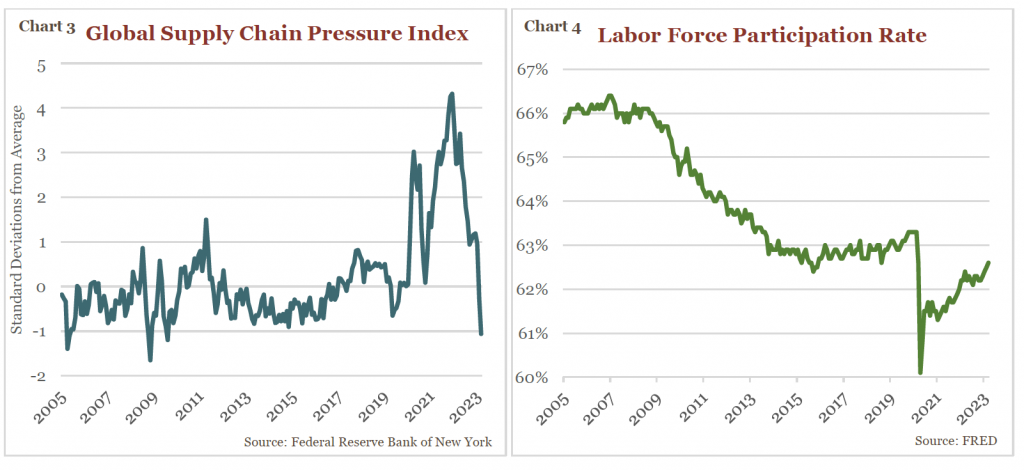
- Covid shutdown mandates also impacted suppliers. Companies were forced to cease or reduce production leading to the scarcity of goods and commodities (see Chart 3).
- Supply of labor, as measured by the labor force participation rate (see Chart 4), fell dramatically during the pandemic, creating a tight labor market and higher wages for many workers.
Disinflationary Process Has Begun
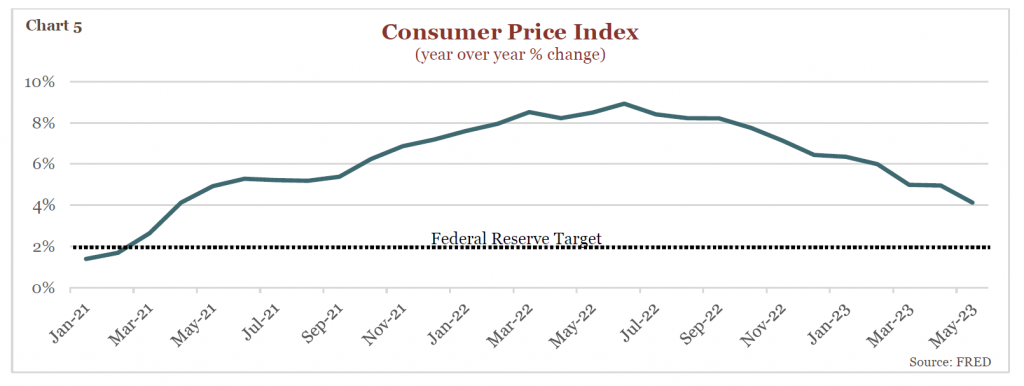
- As the supply and demand side normalize and the Federal Reserve takes monetary action, inflation is trending down toward the Fed’s long-term target of 2%. The latest CPI reading was only 4%, much lower than the peak of 9% in June 2022 (see Chart 5).
U.S. Equities – Earnings Are Falling, The Sky is Not
S&P 500 Earnings Recession
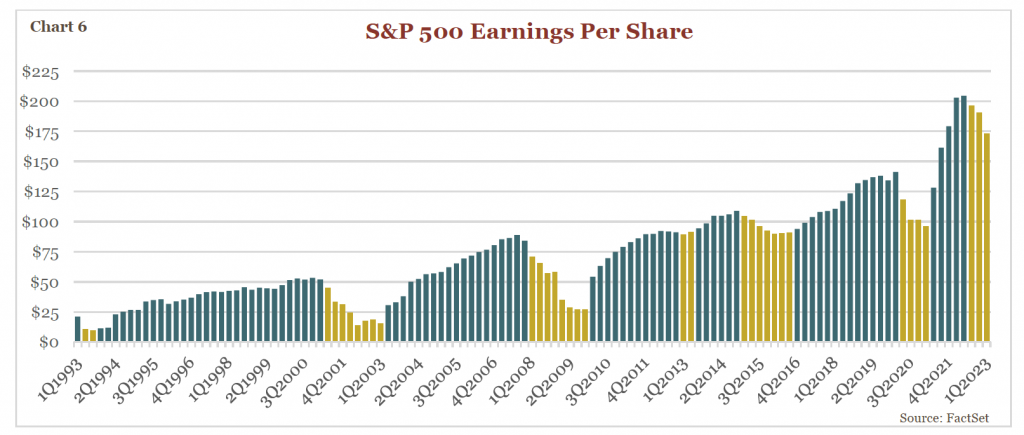
- Soaring inflation and rising rates hurt the bottom line of many S&P 500 companies. As of 1Q2023 the index is currently in a corporate earnings recession (defined by three consecutive quarters of earnings decline – see Chart 6).
- Despite the recent trends in S&P 500 companies’ earnings, the index has had impressive growth over the past 30 years. As of 1Q2023, the index reported earnings per share of $175, well above $24 per share in 1993.
Stocks are Not Overvalued
- Unlike the S&P 500, which predominantly contains companies with a market capitalization above $30 billion (i.e., Large-Cap), GHPIA’s investment strategy diversifies by company size as well as style and sector.
- While Large-Cap companies’ price to earnings ratios are mildly elevated relative to 25- year medians, Mid and Small-Cap company valuations are discounted (see Chart 7).

Fixed Income – Are Bonds Back?
Real Losses Experienced in Bond Funds
- When prevailing interest rates are rising, the prices of older bonds fall because investors demand discounts for the older (and lower) interest payments.
- The fundamental difference between owning a bond outright and owning a bond fund is the latter tends to have high turnover, rarely holding bonds to maturity. This means an investor could lose some or all of the initial investment in the fund.
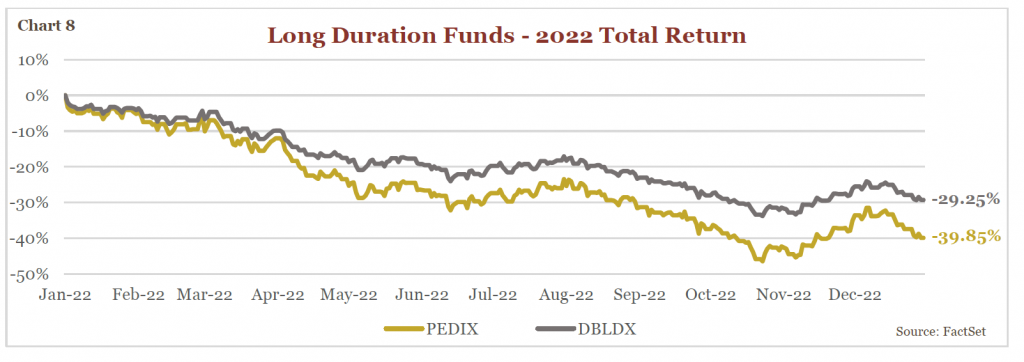
- Chart 8 illustrates an example of two long duration bond mutual funds that experienced substantial losses in 2022 due to rising interest rates. These funds hold bonds with longer maturities (20+ years) which are more sensitive to changes in interest rates. This chart also reinforces why we advised keeping duration short in fixed income portfolios throughout 2022.
Finally, Some Yield in Bonds
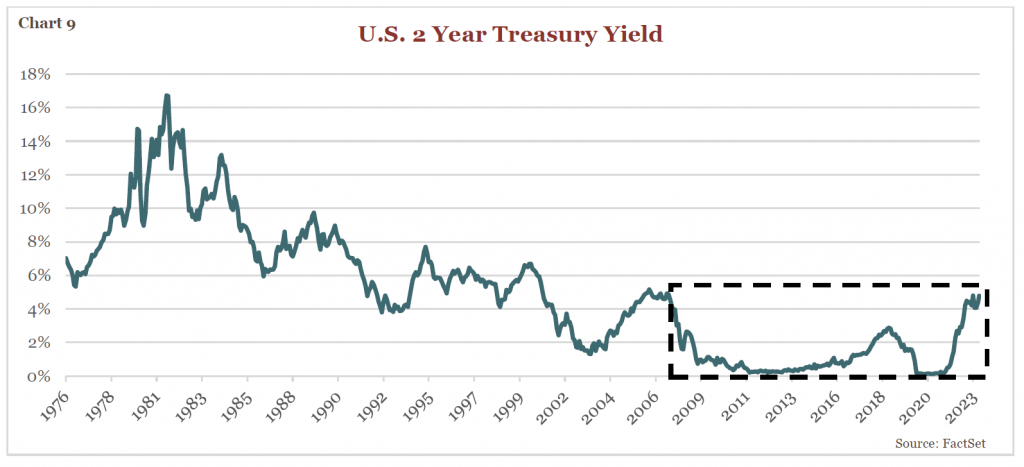
- The U.S. 2-year Treasury yield increased 2,600% over the last two years. The current yield of 4.7% is much higher than the past decade average of 1.38%, however well below the yield in the 70s and 80s (see Chart 9). So, bonds are “sort of” back.
Perspective: Stocks Still Outperform Bonds Over Time
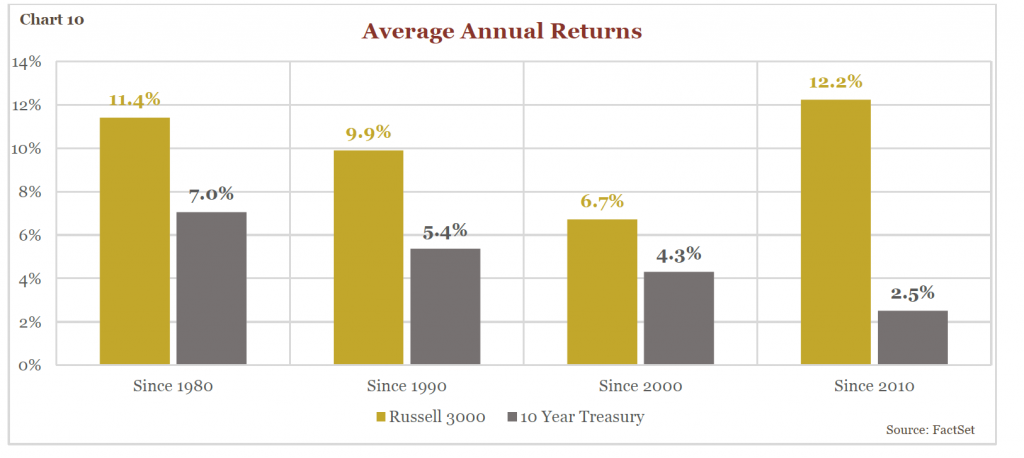
- Even though interest rates are rising, stocks outperformed bonds over time. Since 1980, the difference between investing $10,000 at 11.4% (stocks) or 7% (10- year treasuries) is $854,235 (see Chart 10).
- Allocating to bonds now is a way to avoid volatility in the short-term, but with reasonable stock valuations, we believe stocks are a better long-term opportunity.
U.S. Federal Debt
Debt Ceiling was Increased
- On June 2, Congress passed the debt ceiling package allowing the U.S. to resume borrowing for at least the next 18 months, days before the Treasury Department could have defaulted on the nation’s obligations. The deal will lower federal spending by .2% of Gross Domestic Product (GDP) next year.
- The two parts of America’s budget most critical to defusing its fiscal problems were not included in negotiations: entitlement spending (Medicare and Social Security) and tax revenues.
Now What?
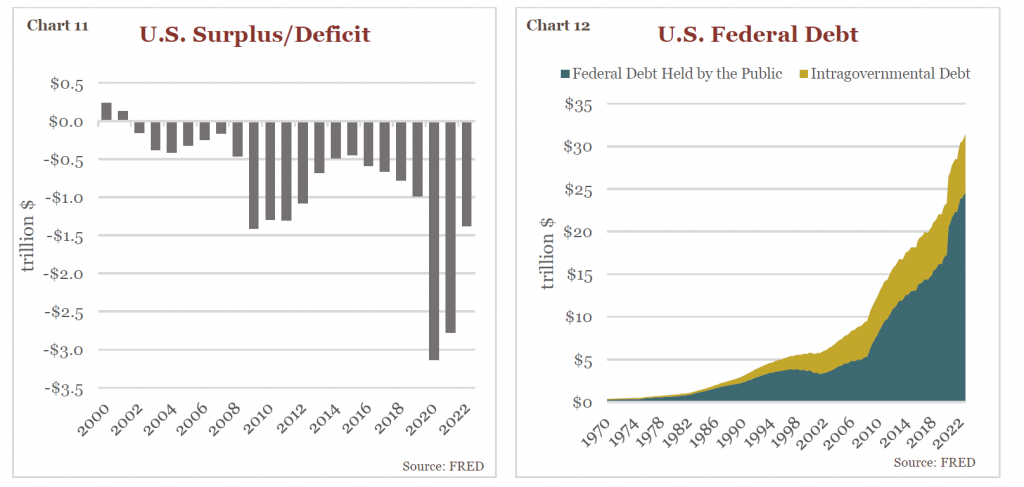
- Passing the debt ceiling bill helped avoid dire consequences in the short term, however, longer term this bill did not address the U.S. government’s chronic revenue shortfall. The U.S. budget deficit averaged over $800 billion since the turn of the century (see Chart 11) and is expected to increase over the next decade (according to Congressional Budget Office projections).
- The underlying mismatch between spending and revenues, as well as the global financial crisis and the pandemic caused the national debt to explode higher in recent years (see Chart 12). Add to this the nation’s rising interest payments, which are projected to reach $1 trillion (or 14% of the total budget by 2030), and the U.S. is on pace to breach the historical high of 106% debt to GDP ratio experienced after World War II.
- Until the U.S. gets spending under control, we will continue to have more of these contentious debt ceiling debates in the future. Ultimately, the U.S. must strive to reduce the debt by a combination of tax hikes, slower spending growth, healthy stable inflation, and economic growth (increased GDP).
Investment Insight is published as a service to our clients and other interested parties. This material is not intended to be relied upon as a forecast, research, investment, accounting, legal, or tax advice, and is not a recommendation, offer or solicitation to buy or sell any securities or to adopt any investment strategy. The views and strategies described may not be suitable for all investors. Individuals should seek advice from their own legal, tax, or investment counsel; the merits and suitability of any investment should be made by the investing individual. References to specific securities, asset classes, and financial markets are for illustrative purposes only. Actual holdings will vary for each client, and there is no guarantee that a particular account or portfolio will hold any or all of the securities listed. Past performance is no guarantee of future results. Investments carry risk and investors should be prepared to lose all or substantially all of their investment.
Latest Posts
More Content


