 ,
,
December 31, 2017
The S&P 500 Index is up over 350% from the stock market bottom of March 9th, 2009. Over this same period, the technology-dominated Nasdaq Index increased by more than 500%. The technology sector is often viewed as an attractive investment in any economy, and significant demand for any sector can result in overvalued stock prices. Despite the increased demand, we do not believe this has created another tech bubble.
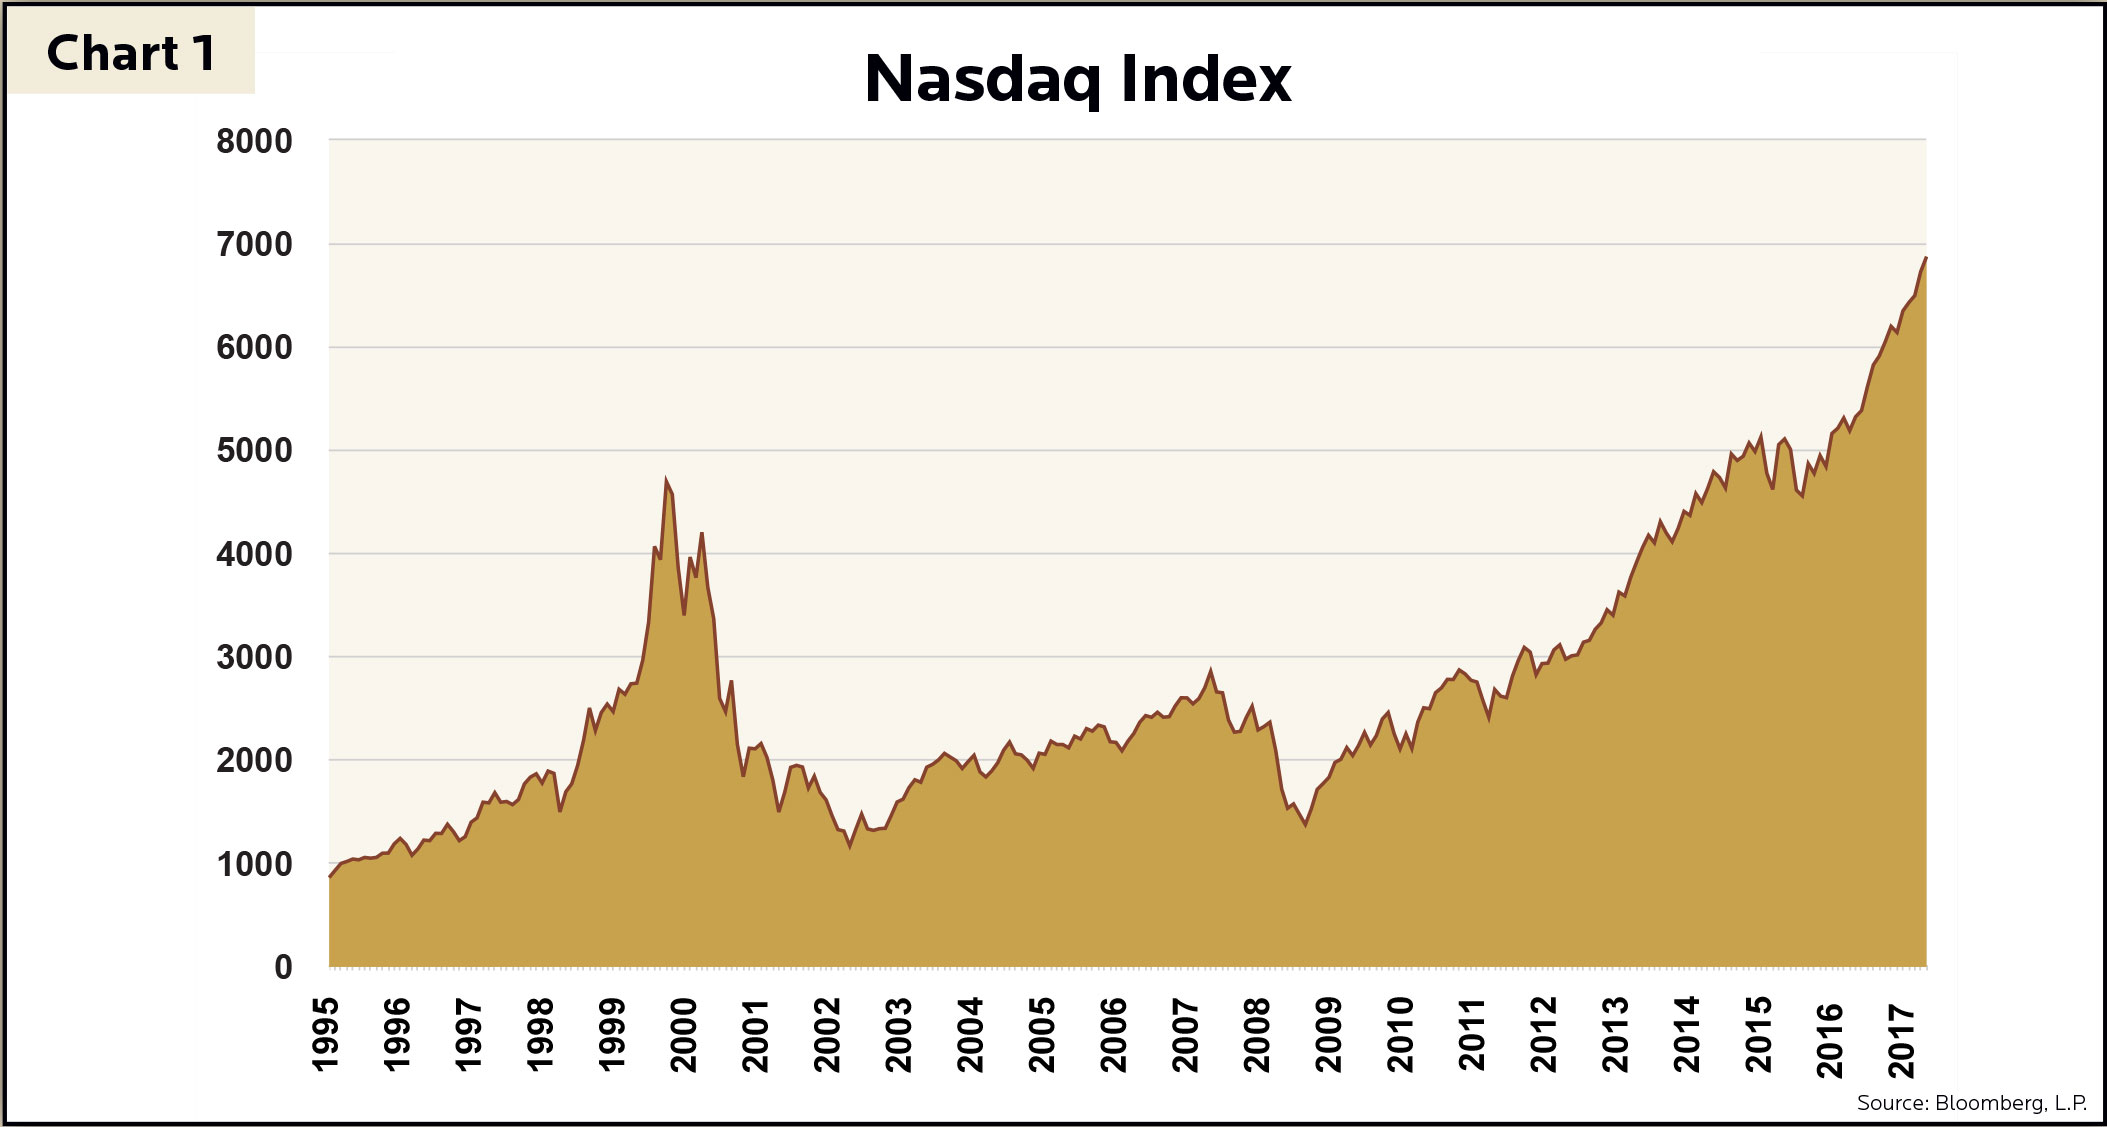
Many might remember the tech build up and bust of the late 1990s and early 2000s – how can you forget since many of us had heart palpitations during this period? The “Dotcom Bubble” occurred in the late 1990s and was defined by a rapid increase in the stock market fueled by investments in internet-based companies. These internet-based or dotcom companies are those that do most of their business on the internet. Many of these companies raised money in the hundreds of millions or even billions of dollars, only to go bankrupt by 2001 due to their inability to turn a profit. In the 1990s, investors piled money into anything with “.com” at the end of its name hoping these companies would one day become big winners. Much of this run up in the stock market was due to speculative investing and large amounts of venture capital funding. Many venture capitalists did not want to miss out on a big pay day from the increasing use of the internet and tossed aside caution when investing in new ventures. The fuel for this growing bubble was built on cheap money, easy capital, market overconfidence and speculation. In Chart 1, the Nasdaq Index exhibits the exponential growth of the technology sector. The Nasdaq rose from below 1,000 to just under 5,000 between 1995 and 2000, only to come crashing back down to under 1,200 in late 2002.
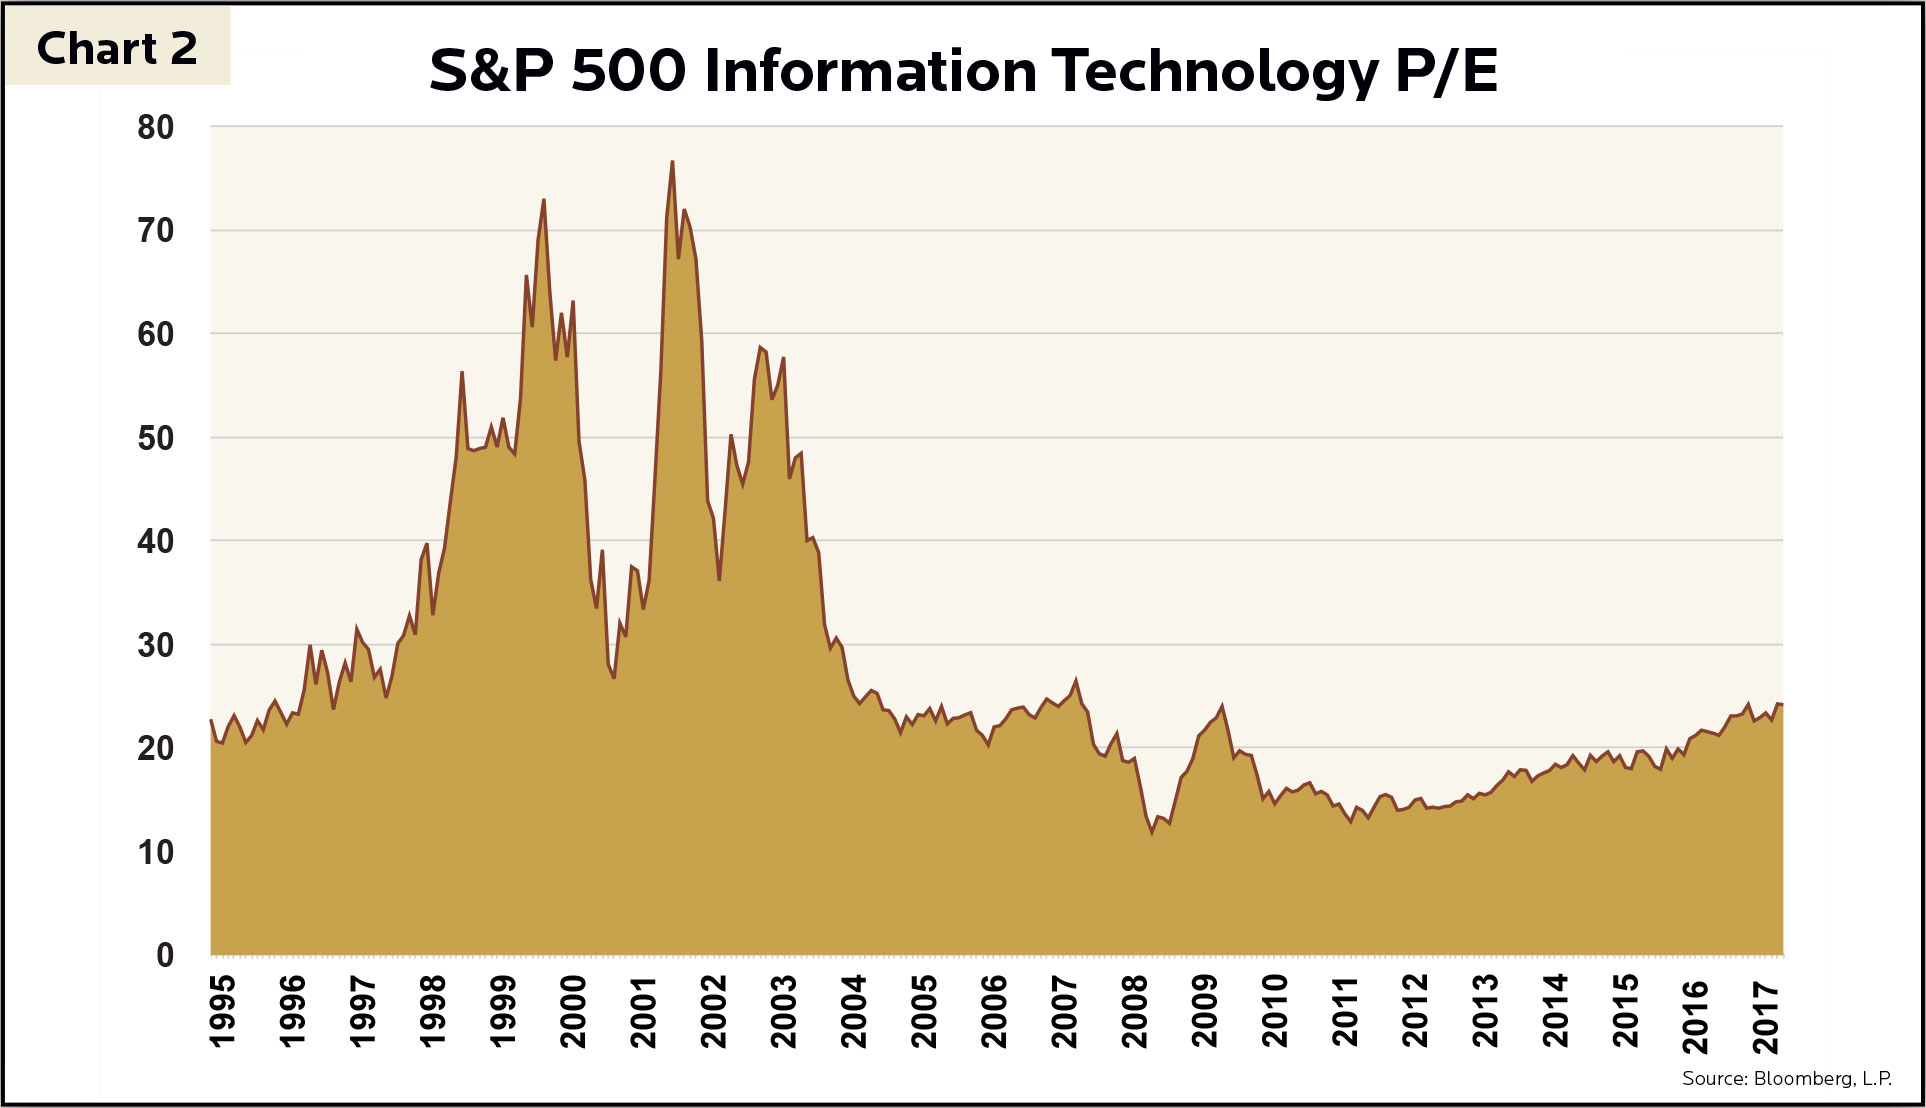
Recently, market sentiment is that we are in the middle of another tech bubble that will soon burst. We disagree with this thought. Reflecting on the technology bubble of the early 2000s, it is clear how multiple contributing factors became an issue. Dotcom companies became publicly traded companies by raising incredible amounts of capital via initial public offerings (IPOs). Many of these companies never even earned revenue, let alone made a profit. Although today’s stock market still participates in technology IPOs, they now make up a far smaller portion of the market. According to Bank of America Merrill Lynch, there were 457 IPOs in 1999, most of which were internet and technology related. Of those 457 IPOs, 117 doubled in price on the first day of trading. In 2001 the number of IPOs dwindled to 76, none of which doubled on the first day of trading. So far in 2017, just 15 technology companies have become publicly traded companies. Today many technology companies are flush with cash. Currently technology is the only sector in the S&P 500 that carries more cash than debt on corporate balance sheets. Domestic cash levels should grow even higher with the new tax plan, which will allow companies to bring funds stashed overseas back to the U.S. under a lower rate. Many companies left these earnings in foreign bank accounts because of the high U.S. repatriation tax. When evaluating stocks, we compare current market conditions to our own benchmark valuations. If the valuations exceed our benchmark, we look to better understand why. Today, these valuations look better than in the early 2000s but still exceed our benchmark criteria. At the peak of the bubble in March 2000, the S&P 500 Information Technology Index was trading at a price-to-earnings ratio (P/E) of 73 (see Chart 2). A high P/E doesn’t necessarily mean a stock is a bad investment, it typically means the market is expecting the company to have high growth, but at a high price. The elevated P/E ratios of the early 2000s were well over the average of the last 15 years at 23, as well as its current level of 24 as of 11/30/2017. Today P/E valuations are much more reasonable than in the past. Although we do not believe technology stocks are in a bubble, many still exceed our valuation criteria.
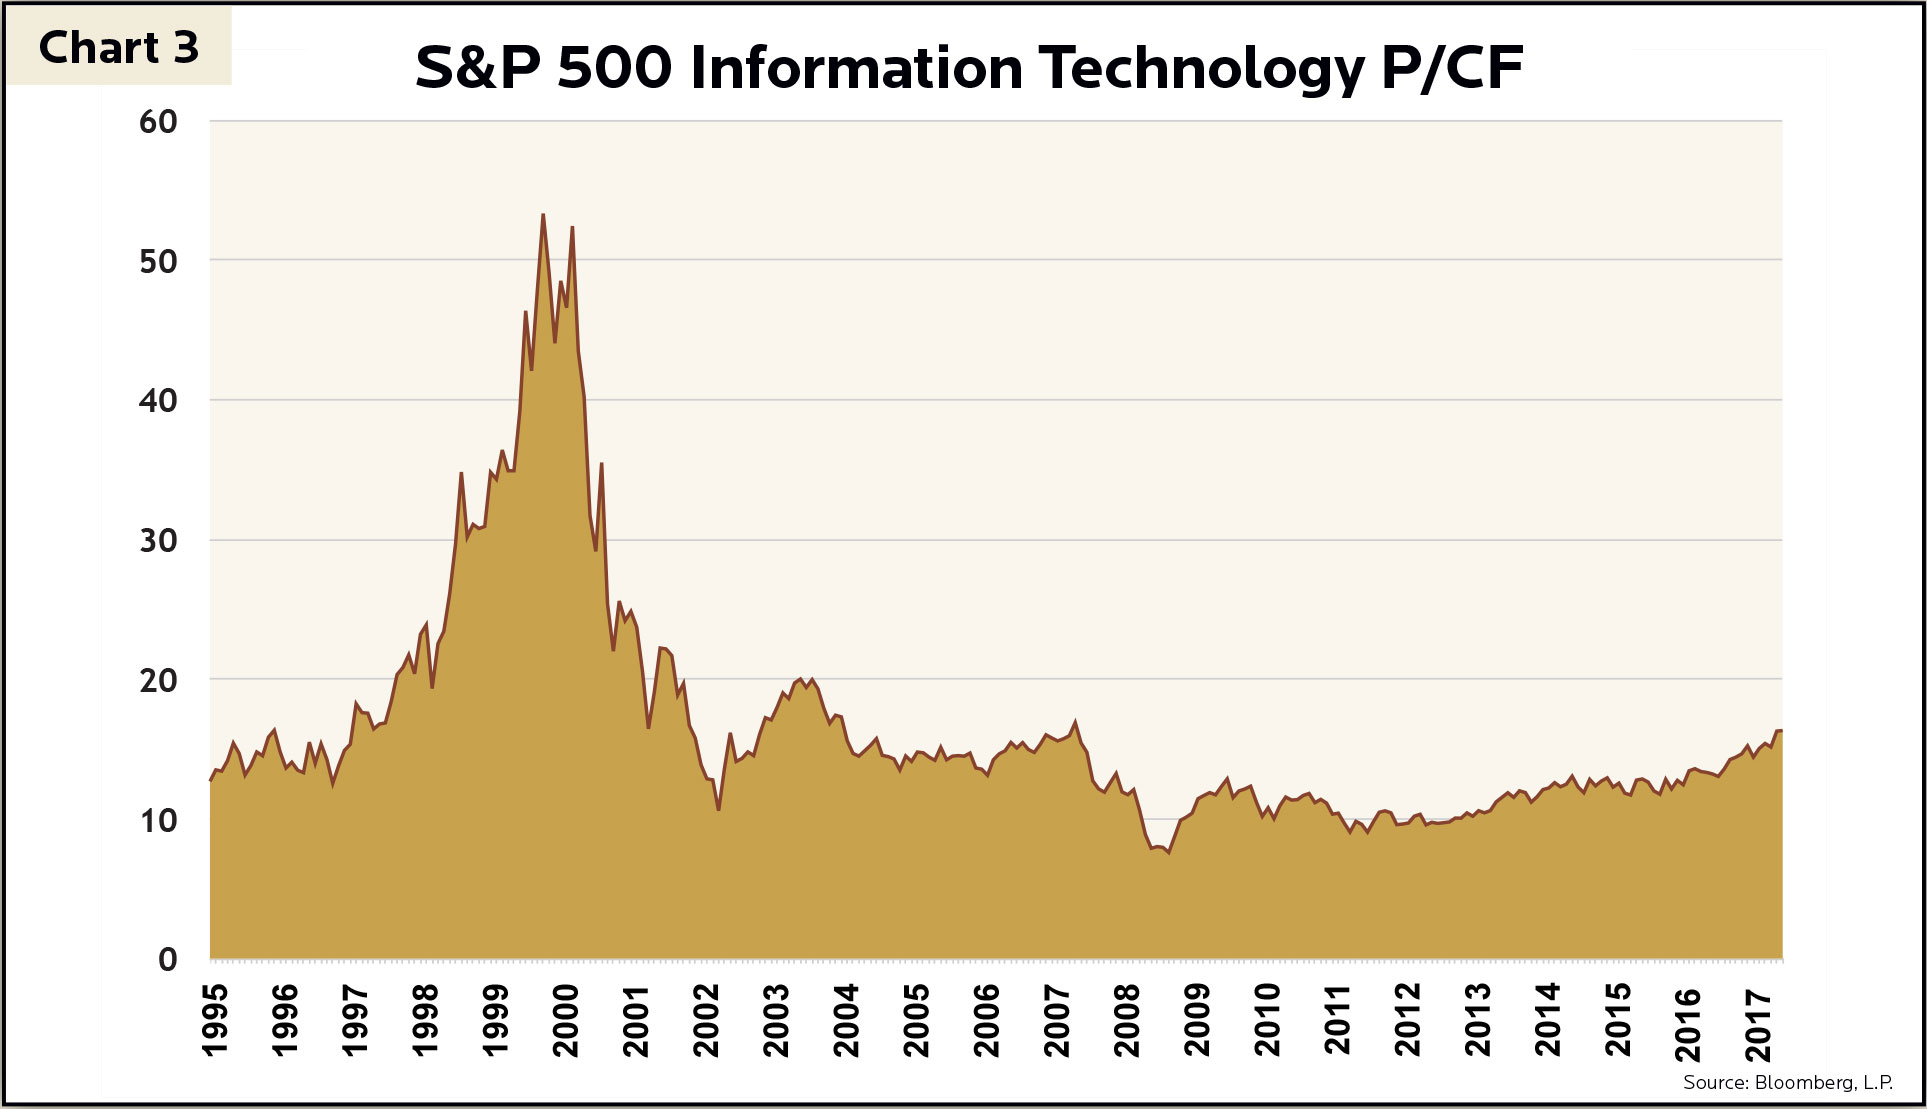
The same is true when looking at the price-to-cash flow (P/CF) ratio (see Chart 3). In March 2000, the S&P 500 Information Technology Index was trading at a P/CF ratio of 53. This P/CF ratio may seem low compared to the high P/E ratio, but the current price-to-cash flow of the S&P 500 Information Technology Index is 16, a 70% discount from the P/CF of early 2000. P/CF valuations today are much more reasonable when comparing to early 2000s, but many still exceed our valuation criteria.
We measure a company’s profitability using a proprietary metric we created for our own investment methodology, the GHP Profit Stability Score (PSS). The PSS is calculated based on a company’s operating profit margin and the standard deviation of those margins over time. The PSS quantifies both the strength and volatility of a company’s earnings; the higher the score the better. In other words, this metric is an indicator for how stable a company’s profits are over a certain period. For example, a company earning an average operating profit margin of 20% that grows consistently at 3% per year has a high Profit Stability Score – operating profits are strong and steady. In contrast, another company earns the same 20% average operating profit margin, but that margin swings up or down 15% every year – this company has a much lower PSS than the former, because operating profits are strong on average but unattractively volatile. Currently, the PSS for the Nasdaq index is at 5.6, compared to 1.29 in early 2000. This shows just how much better the PSS is today due to steady and robust tech cash flows for most in the sector when compared to the PSS scoring of the late 90’s.
The “dotcom” bubble of the 1990s and early 2000s was a period of excess speculation on the growth and adoption of the Internet. Although we do not believe technology stock valuations are in a bubble similar to 1999-2000, many companies still exceed our valuation criteria. We do not believe in investing based on speculation and feel that valuation and diversification are important. By not having overexposure to any one sector we believe we are positioned for both expected and unexpected events in the market. By sticking to our stringent benchmarking methodology and continuing to look for undervalued, high growth and diversified investments, we hope to avoid the tech-like bubbles in the future. We continue to invest in tech stocks fitting within our benchmark boundaries while avoiding tech stocks we see as currently overvalued. Still, the tech sector as a whole is nowhere near valuations resembling the tech bubble of the late 90s.
Investment Insight is published as a service to our clients and other interested parties. This material is not intended to be relied upon as a forecast, research, investment, accounting, legal or tax advice, and is not a recommendation, offer or solicitation to buy or sell any securities or to adopt any investment strategy. The views and strategies described may not be suitable for all investors. References to specific securities, asset classes and financial markets are for illustrative purposes only. Past performance is no guarantee of future results.