 ,
,
June 30, 2017
The Big Short by Michael L. Lewis is based on the true story of four outsiders who took advantage of what the big banks, rating agencies and government refused to realize: the United States economy was primed for a collapse. This movie explains how complex financial instruments backed by subprime mortgages and other collateralized debt obligations led to the worst financial crisis since the Great Depression.
The Big Short stressed the 2008 financial crisis was caused by a confluence of factors. The deepest roots, however, included irresponsible mortgage lending to borrowers with lackluster credit history and big banks selling investors securities backed by these subprime mortgages. The unexpected, dramatic downturn of the housing market and the unprecedented level of consumers defaulting on their mortgages set off a chain of events solidifying the crisis – banks’ balance sheets were decimated by the loss in value of mortgage-backed securities, trust was lost amongst market participants, and many banks stopped lending altogether.
“The entire modern worth was premised on the ability to buy now and pay later.” -Michael L. Lewis
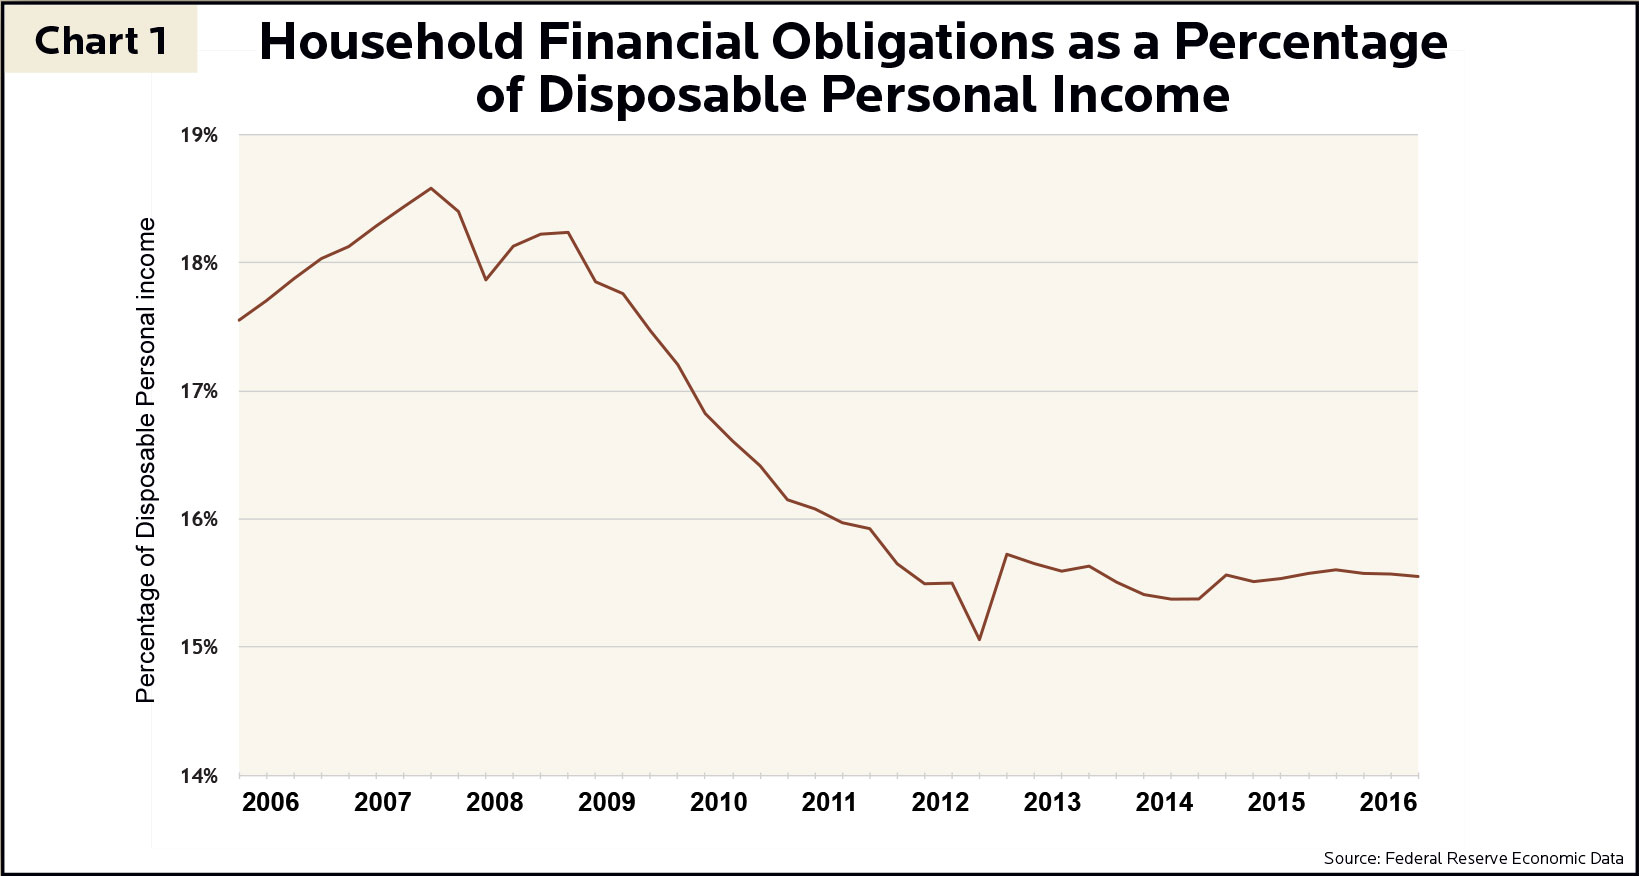
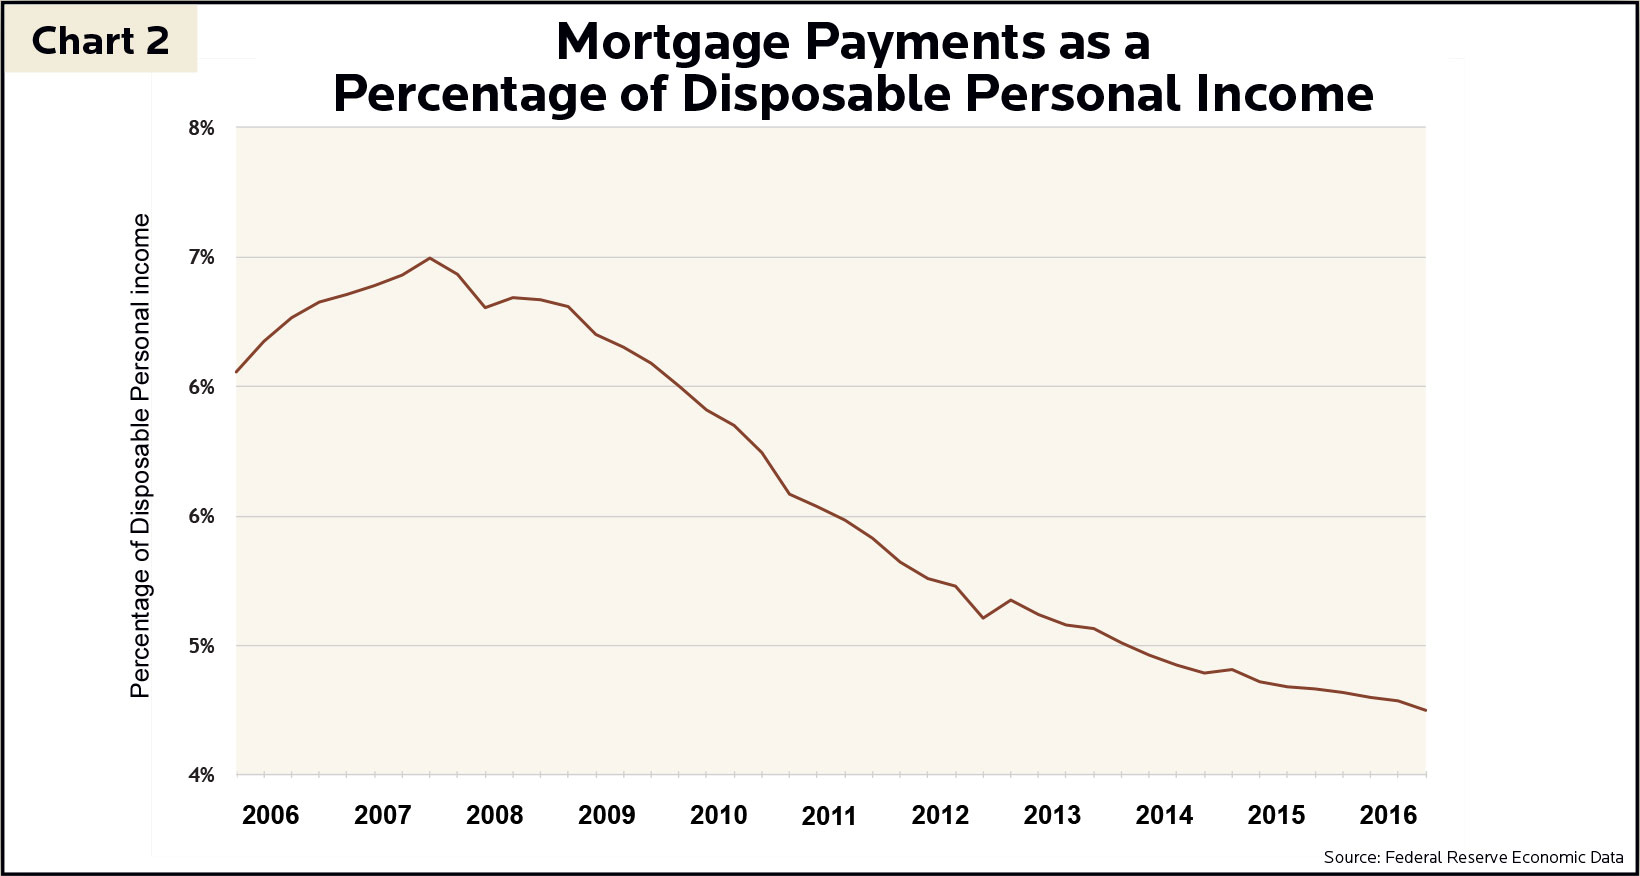
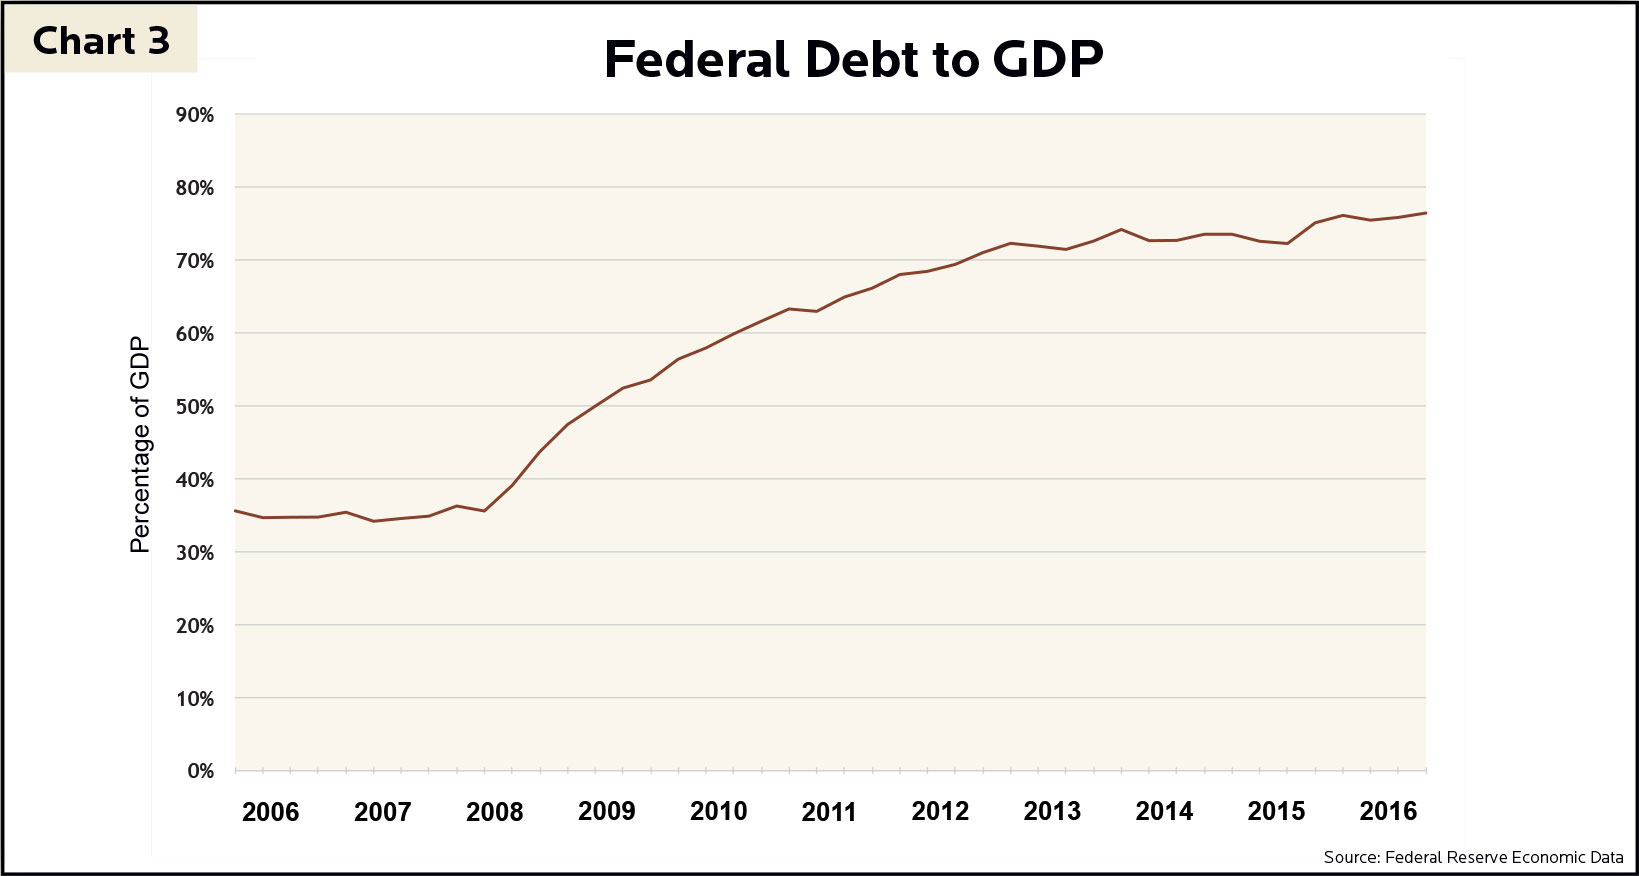
Domestic debt in the United States is categorized into six sectors: federal government, households, financial institutions, corporations and state and local government. Aside from the federal government, the balance sheets of these sectors improved significantly. For example, Chart 1 and Chart 2 illustrate the recovered health of consumers. Both household financial obligations and mortgage payments as a percentage of disposable income declined drastically since 2007. Contrarily, federal government debt ballooned as a percentage of gross domestic product (Chart 3), but it is important to remember federal debt levels did not cause the 2008 financial crisis. Since the crisis, homeowners and banks lowered their outstanding debt making it unlikely we will see a sequel to the Big Short.
In the aftermath of the financial crisis, federal government debt grew over $9 trillion, which now represents over 70% of Gross Domestic Product (GDP) (Chart 3). This spending initially bailed out big banks and has since spurred economic growth to climb out of the recession. Within government spending, four categories account for over 80% of the total: health care (28%), social security (25%), defense (15%) and income security (13%). Notice that interest expense did not make the list. Currently, the interest cost to service $19.8T of U.S. federal debt is only 6% of total spending, down from over 15% twenty years ago when interest rates were higher.
As interest rates increase, the cost of borrowing will likewise rise. Given the average maturity of government debt is 4.78 years, interest costs will remain stable for some time until the government begins refinancing its debt at higher interest rates. If government spending and federal debt increase at the average rate of the last three years and average borrowing costs rise from 1% to 3%, interest expense will double. Suddenly servicing government debt becomes 12.7% of overall spending. Despite these problems, it is unlikely the U.S. government will default on its debt. If Michael Lewis writes the Big Short 2 – it appears the federal government might be the lead actor, unless prudent fiscal leadership prevails.
Leading up to the financial crisis, home mortgage debt was increasing more than one trillion dollars per year. Michael Lewis portrayed a precarious trend in the U.S.: “With stagnant wages and booming consumption, the cash-strapped American masses had virtually unlimited demand for loans but an uncertain ability to repay them.” To quench the desire of consumers, banks doled out high-risk loans with unconventional terms, such as adjustable interest rates and variable payments. Due to rising home prices, lenders believed these loans were safe bets, given expectations that properties could sell for at least the loan balance if the borrower could no longer make payments. When the housing bubble popped, borrowers owed more than what their homes were worth. At the same time borrowers began defaulting, and in response, banks reined in lending activity forcing the reduction of homeowner debt.
Nine years later, mortgage and consumer debt declined nearly $700 billion dollars to $14.7T in 2016, all while national home prices rose. Likewise, average FICO (credit) scores increased from 715 to 755 – money is loaned to higher quality borrowers, significantly reducing delinquency and default rates. As indicated in Chart 2, Americans spend 4.4% of total disposable income on mortgage payments (i.e. “mortgage debt service ratio”), as opposed to 7.2% pre-crisis. The mortgage debt service ratio is at the lowest level since 1980.
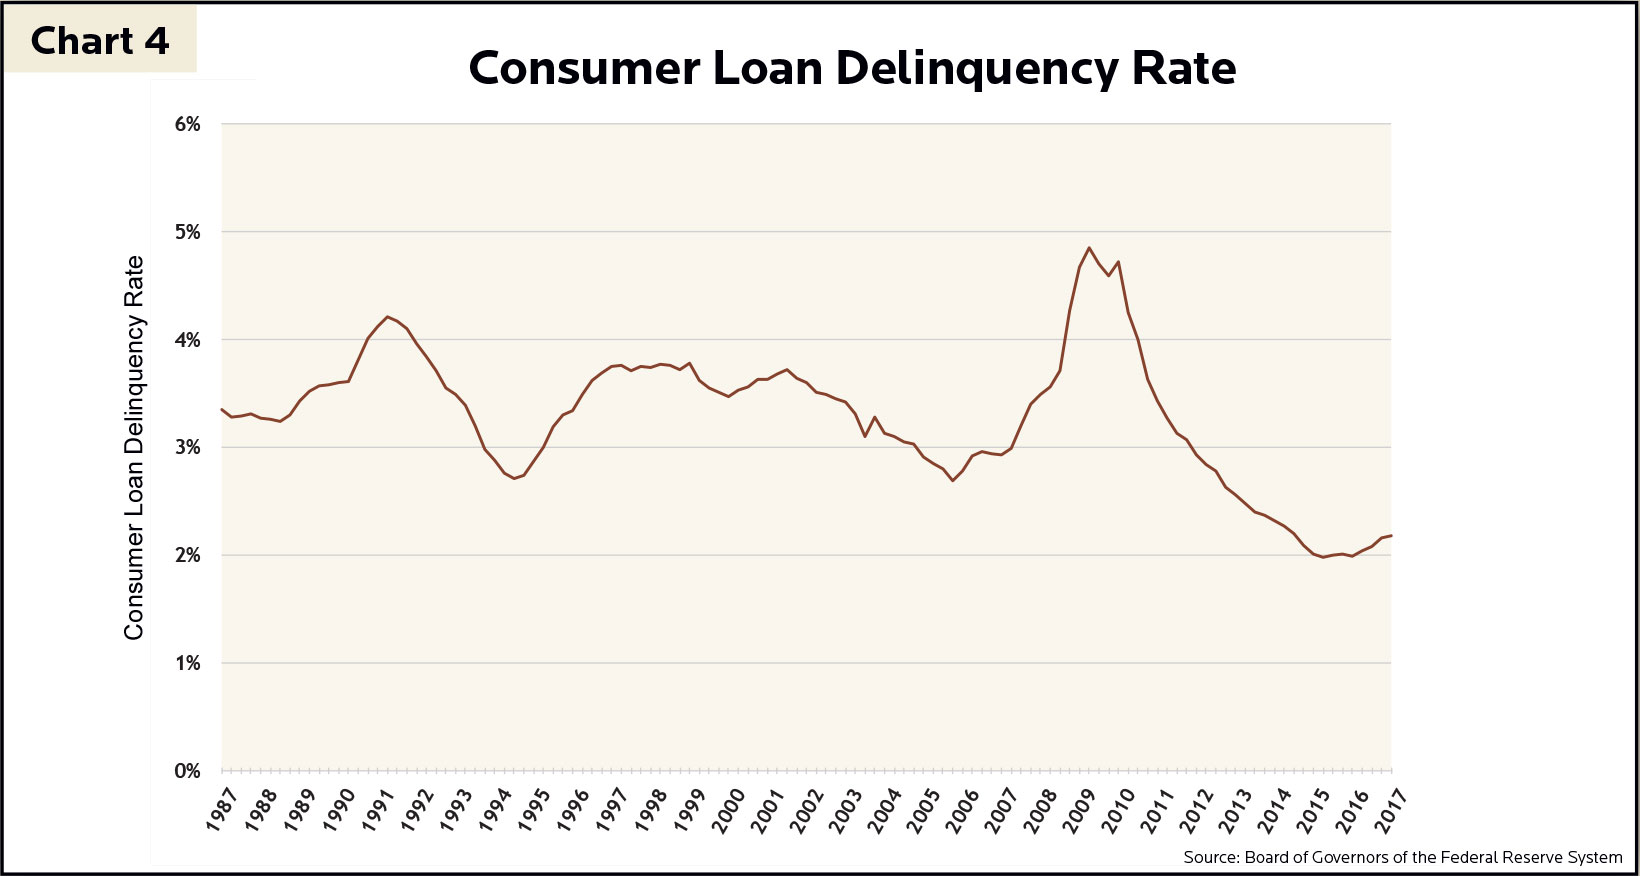
Households borrowed differently in 2008 than today. Student loan debt now accounts for 11% of household debt, up from 5% in the third quarter of 2008. Auto loans today total 9% of household debt, up from 6% in 2008. Auto loan defaults crept up, but these types of loans still account for only 1% of the total debt outstanding in the United States. Meanwhile, the consumer loan delinquency rate is at its lowest level in the last thirty years (Chart 4). Household debt will not make an appearance in the Big Short 2.
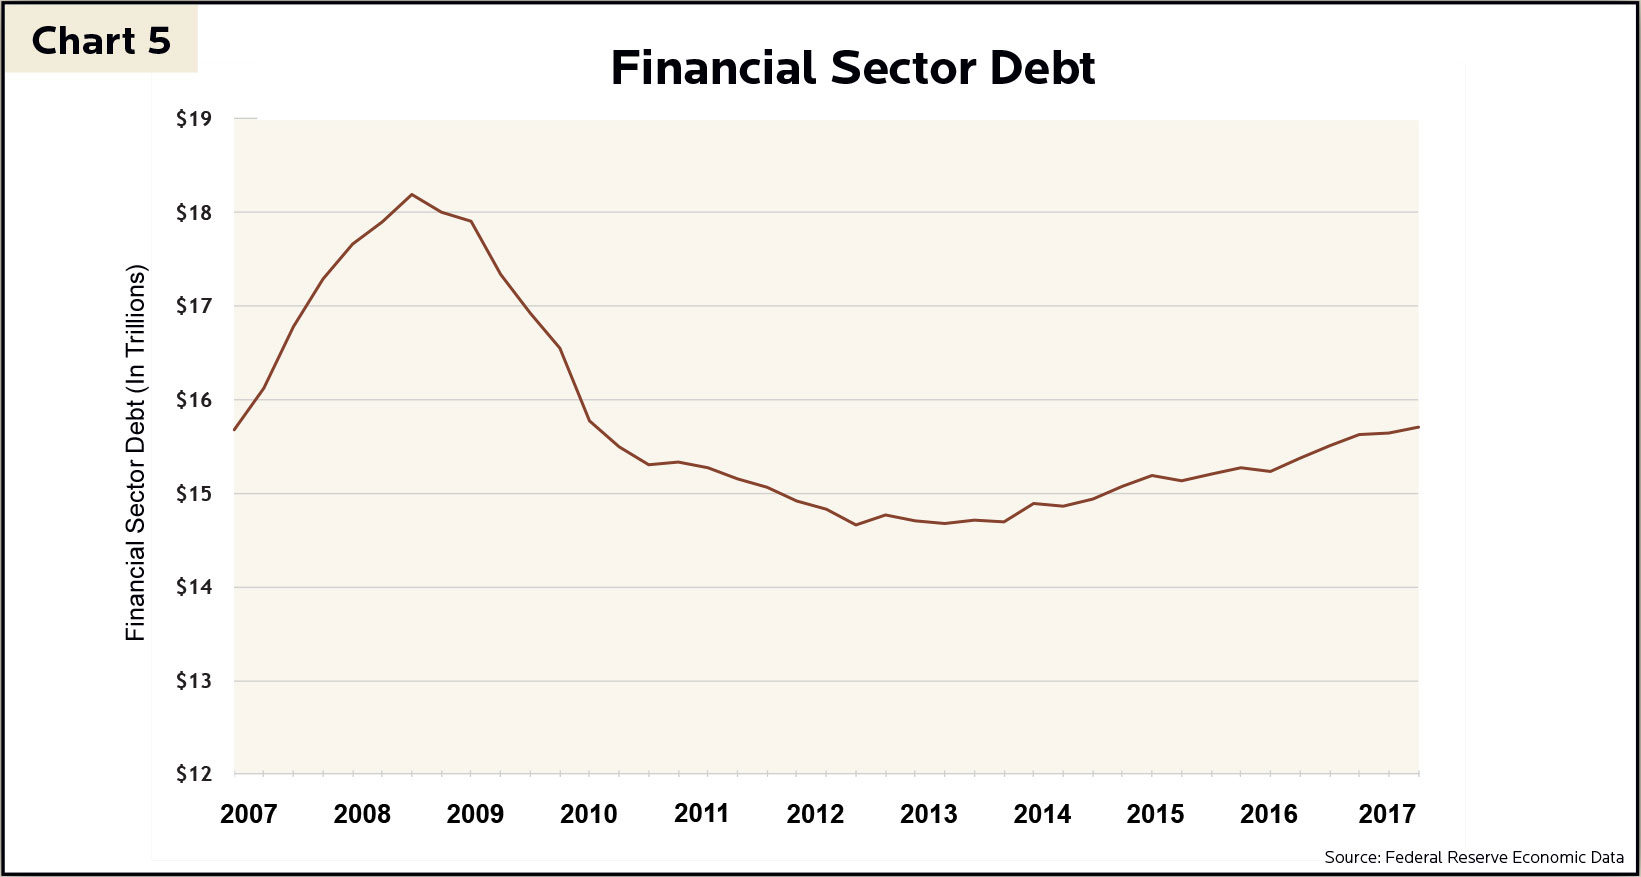
Debt in the financial sector is more than two TRILLION dollars lower than its peak in 2008 (Chart 5). At the height of lending, highly leveraged investment banks like Lehman Brothers and Bear Stearns had $30 of debt for every dollar of cash on hand. Many of these institutions are extinct in the wake of the financial crisis after filing for bankruptcy or being acquired by larger, more solvent institutions. In response to the vulnerabilities identified during the crisis, federal banking regulatory agencies raised requirements for the quality and level of capital held by all banks (tier 1 capital). The proportion of tier 1 capital to risk-weighted assets on a bank’s balance sheet (tier 1 capital ratio) is a core measure of financial strength. Average tier 1 capital ratio across the biggest banks in the U.S. is at its highest in 30 years at approximately 13%, much higher than the pre-crisis level of around 8%. Banks, the leading stars of the Big Short, will not even be offered a part as an extra in the Big Short 2.
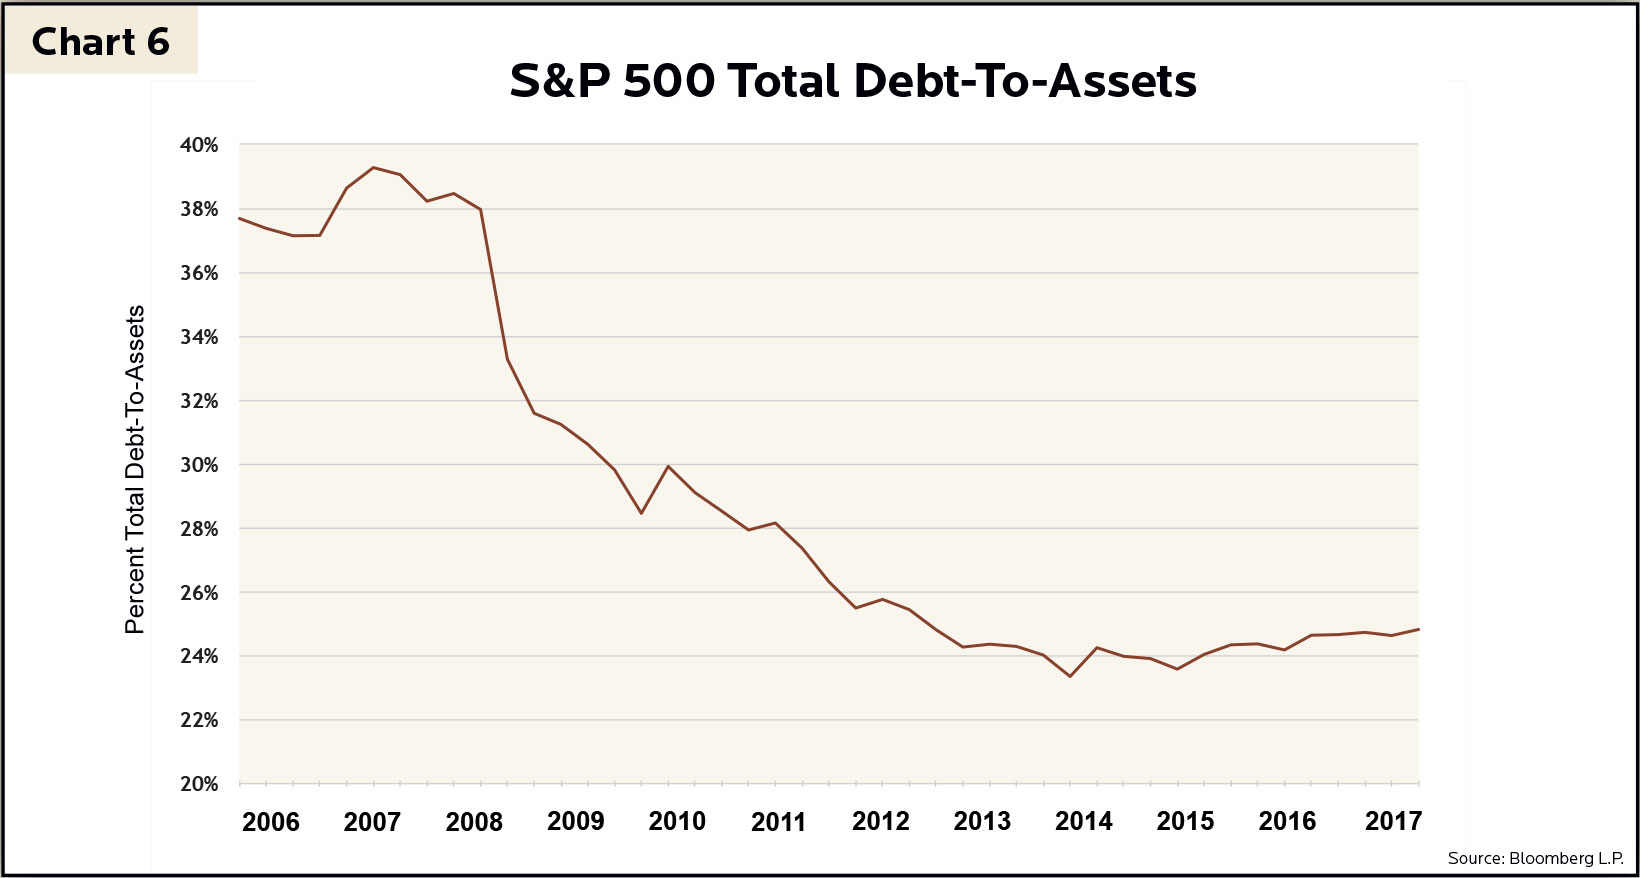
After the 2008 financial crisis, companies immensely strengthened their balance sheets. Debt as a percentage of assets for the largest companies in the U.S. was almost cut in half to just 25% (Chart 6). Corporations exploited the low interest rate environment by refinancing their debt to longer-term and lower fixed-rate obligations. Corporations bombed the audition for the Big Short 2.
State and Local Governments
In contrast to federal debt, state and local government debt balances ticked up only slightly since the onset of the financial crisis. In 2007, state and local governments had $2.9T of debt outstanding whereas current debt outstanding today sits at $3.1T. With only a few exceptions, states and municipalities navigated the Great Recession prudently with their credit profiles intact. Policymakers managed the difficult environment by maintaining a sustained focus on balanced budgets which will remain tight in the years to come. State and local governments did not even make a cameo appearance in the Big Short and will not be in the Big Short 2.
In the aftermath of the 2008 financial crisis, American households, financial institutions, corporations, and local governments improved their balance sheets. While federal government borrowing arguably poses the largest risk in the U.S. debt structure, the economy continuously shows signs of growth. Unemployment numbers dropped to their pre-crisis level of approximately 4.5% compared to the peak of 10% in October 2009, real gross domestic product (GDP) rose 12% since 2007, and household net-worth levels increased by $28T over the last decade.
The Big Short ends by recapping the trillions of dollars lost in the financial crisis. Over eight million Americans lost their jobs, and six million people lost their homes. Do current debt trends in our economy provide enough material to warrant a sequel? We believe not. Unfortunately for Michael Lewis, the Big Short 2 cannot be based on a true story. When assessing the complexion of debt across the various sectors in the United States today, there simply is not enough material.
Investment Insight is published as a service to our clients and other interested parties. This material is not intended to be relied upon as a forecast, research, investment, accounting, legal or tax advice, and is not a recommendation, offer or solicitation to buy or sell any securities or to adopt any investment strategy. The views and strategies described may not be suitable for all investors. References to specific securities, asset classes and financial markets are for illustrative purposes only. Past performance is no guarantee of future results.